Open Access
Fig. 8
Download original image
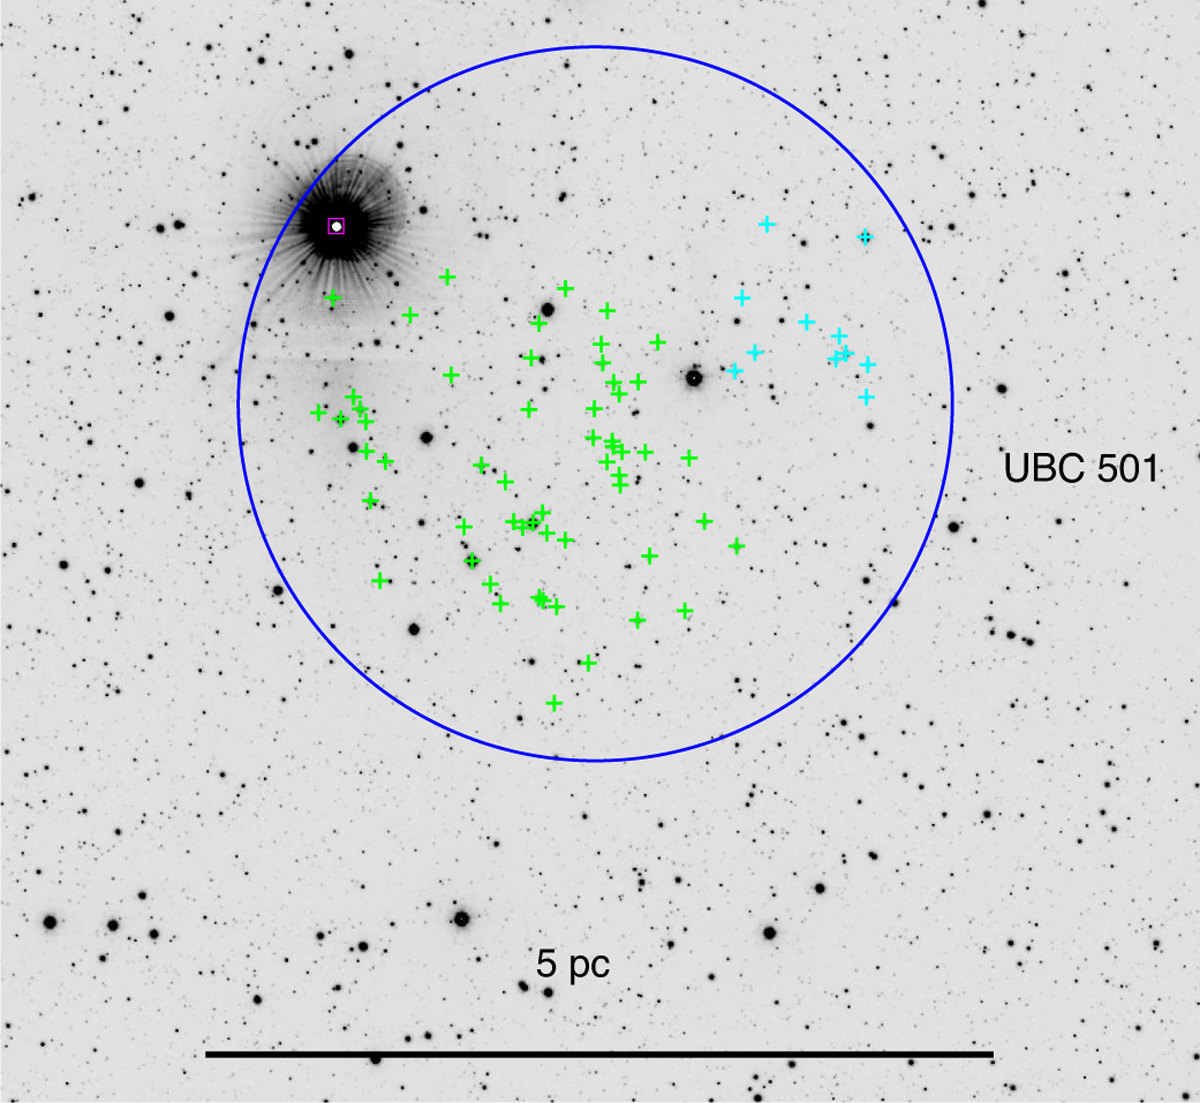
VISTA J-band image of the northwestern part of the CNC. The DBSCAN members of the cluster UBC 501 are marked by crosses. The red supergiant HD 303250 (M3Iab) is marked by the magenta box. Stars in clusters have different colors in order to differentiate the subclusters.
Current usage metrics show cumulative count of Article Views (full-text article views including HTML views, PDF and ePub downloads, according to the available data) and Abstracts Views on Vision4Press platform.
Data correspond to usage on the plateform after 2015. The current usage metrics is available 48-96 hours after online publication and is updated daily on week days.
Initial download of the metrics may take a while.