Fig. 4
Download original image
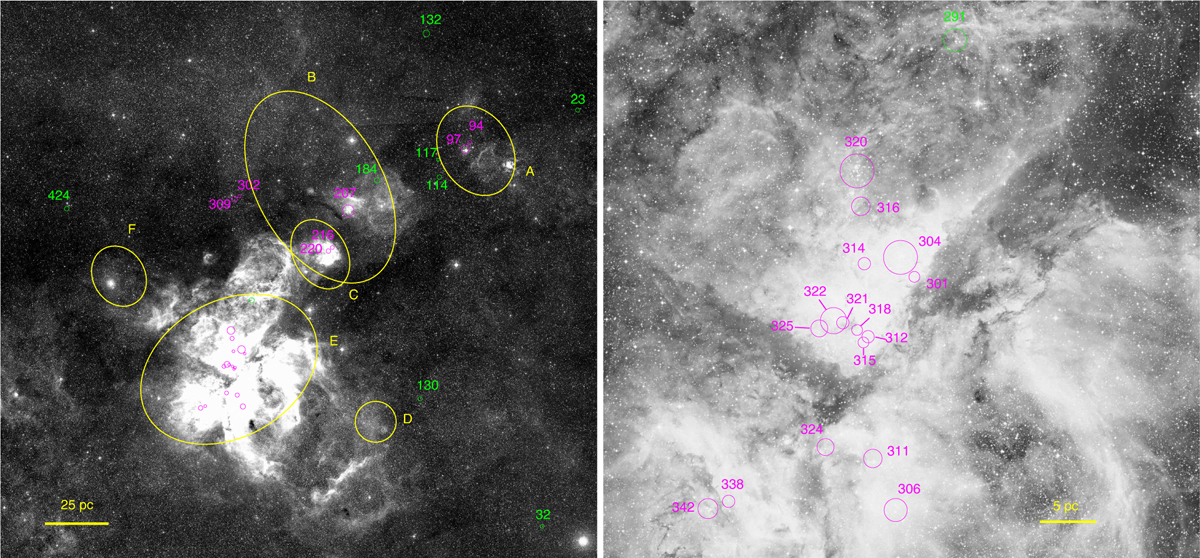
Optical image of the CNC. (Left panel: DSS2 red in grayscale; right panel: DSS2 red in grayscale www.eso.org/public/images/eso0905b/; image credit: ESO/Digitized Sky Survey 2, Davide De Martin). North is up and east to the left. The circles show the clusters and groups whose distance and age is compatible with being a part of Car OB1. Circles in magenta represent clusters with counterparts in the literature, circles in green clusters without counterparts. The clusters’ radii are chosen as the radii in which 75% of their cluster members reside.
Current usage metrics show cumulative count of Article Views (full-text article views including HTML views, PDF and ePub downloads, according to the available data) and Abstracts Views on Vision4Press platform.
Data correspond to usage on the plateform after 2015. The current usage metrics is available 48-96 hours after online publication and is updated daily on week days.
Initial download of the metrics may take a while.