Fig. 2
Download original image
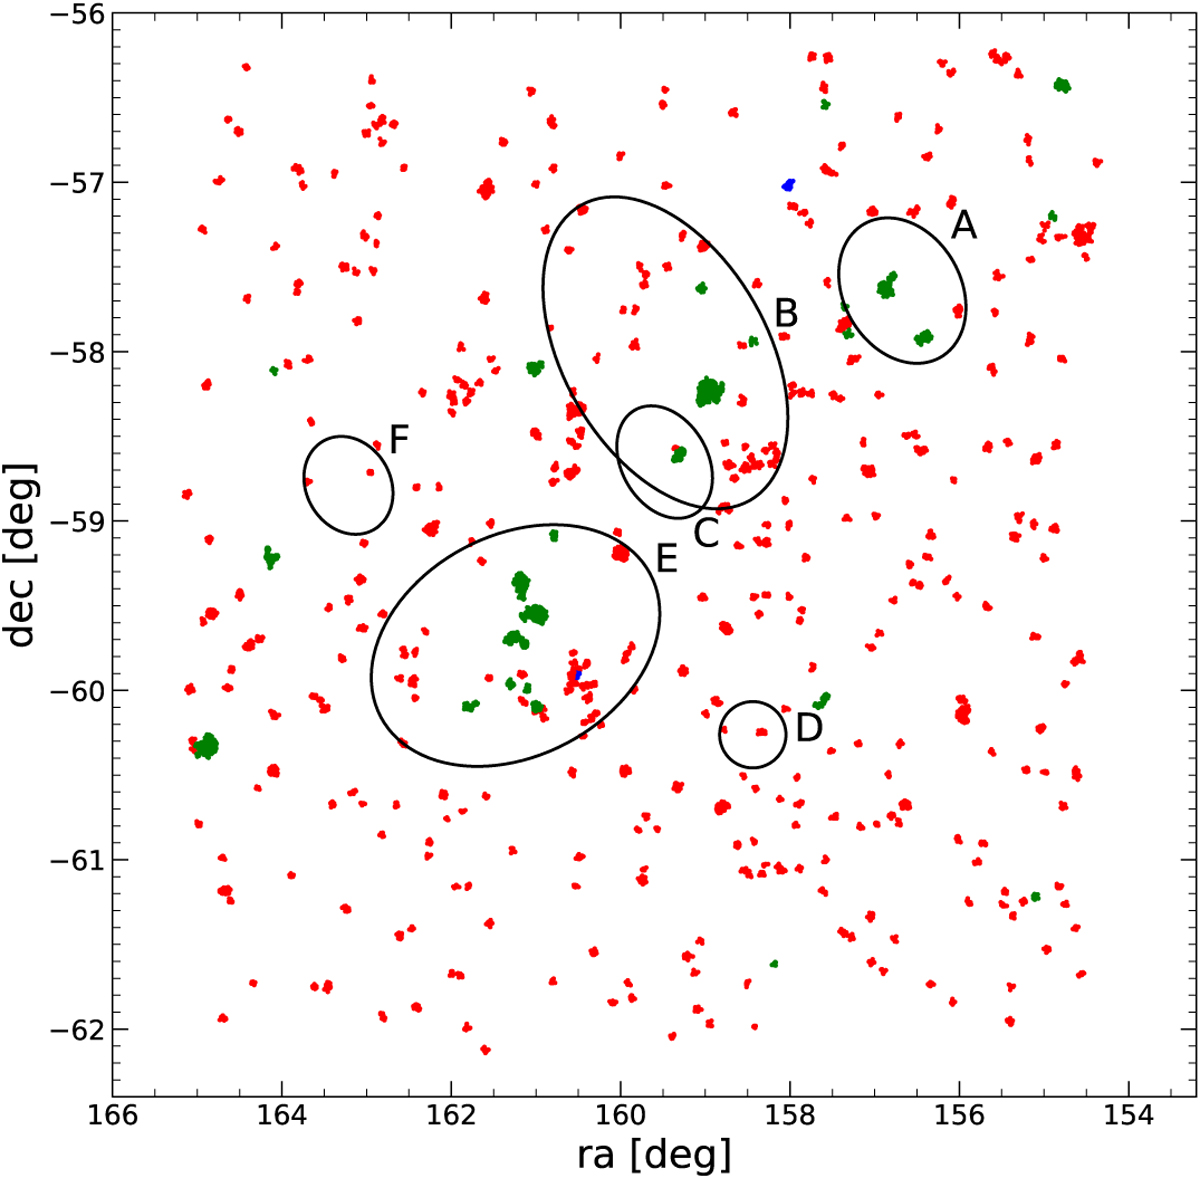
Map of all clusters and groups identified with DBSCAN in the investigated region. Clusters with a mean parallax that is consistent with the distance of the CNC (2.35 kpc) are shown in green, clusters in the background in red, and clusters in the foreground in blue. The ellipses show the Car OB1 subgroups as defined by Mel’Nik & Efremov (1995).
Current usage metrics show cumulative count of Article Views (full-text article views including HTML views, PDF and ePub downloads, according to the available data) and Abstracts Views on Vision4Press platform.
Data correspond to usage on the plateform after 2015. The current usage metrics is available 48-96 hours after online publication and is updated daily on week days.
Initial download of the metrics may take a while.