Open Access
Fig. 18
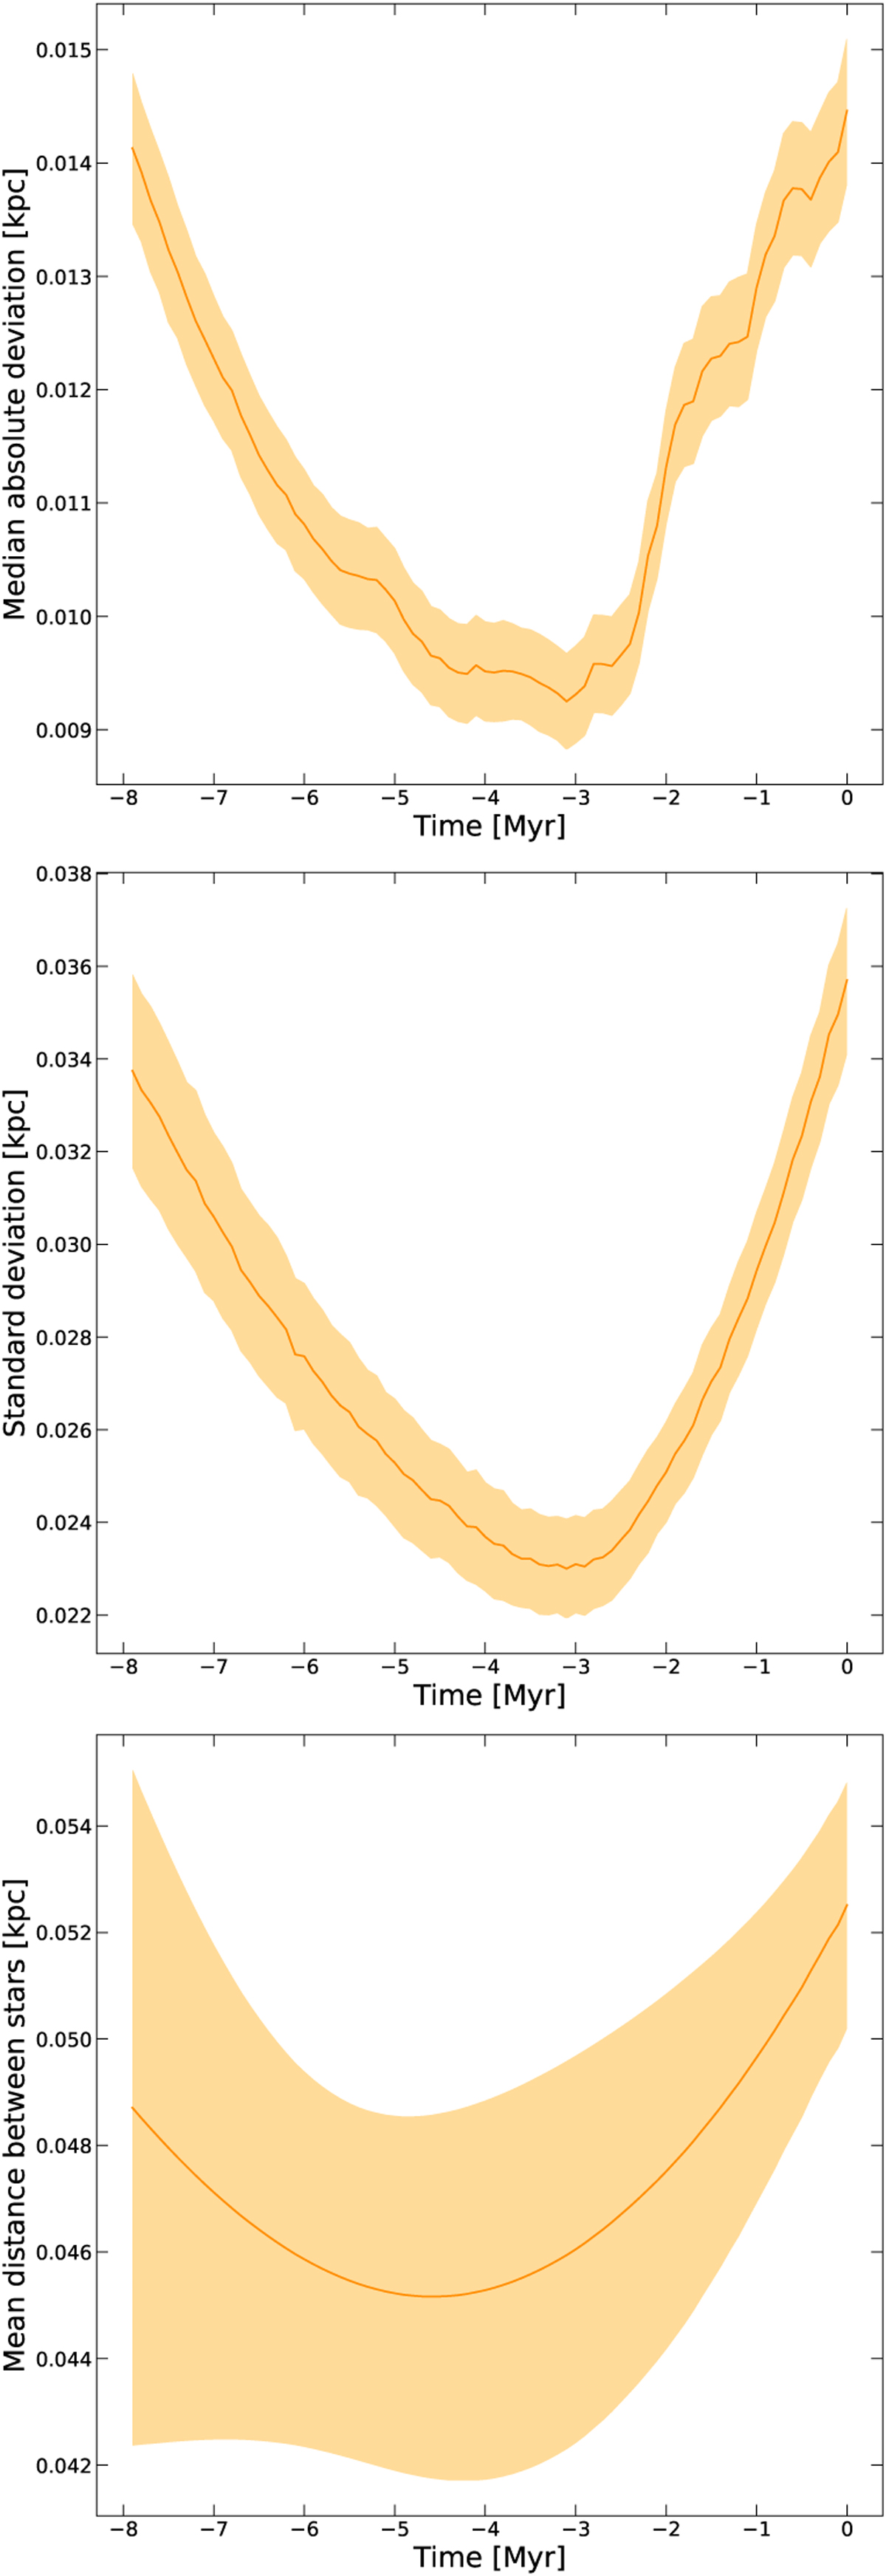
Download original image
Three methods to trace the size of Car OB1 over time. The methods are median absolute deviation of the stars’ position to the association’s center (upper plot), standard deviation of the association (middle), and mean distance between all stars (lower plot).
Current usage metrics show cumulative count of Article Views (full-text article views including HTML views, PDF and ePub downloads, according to the available data) and Abstracts Views on Vision4Press platform.
Data correspond to usage on the plateform after 2015. The current usage metrics is available 48-96 hours after online publication and is updated daily on week days.
Initial download of the metrics may take a while.