Fig. 13.
Download original image
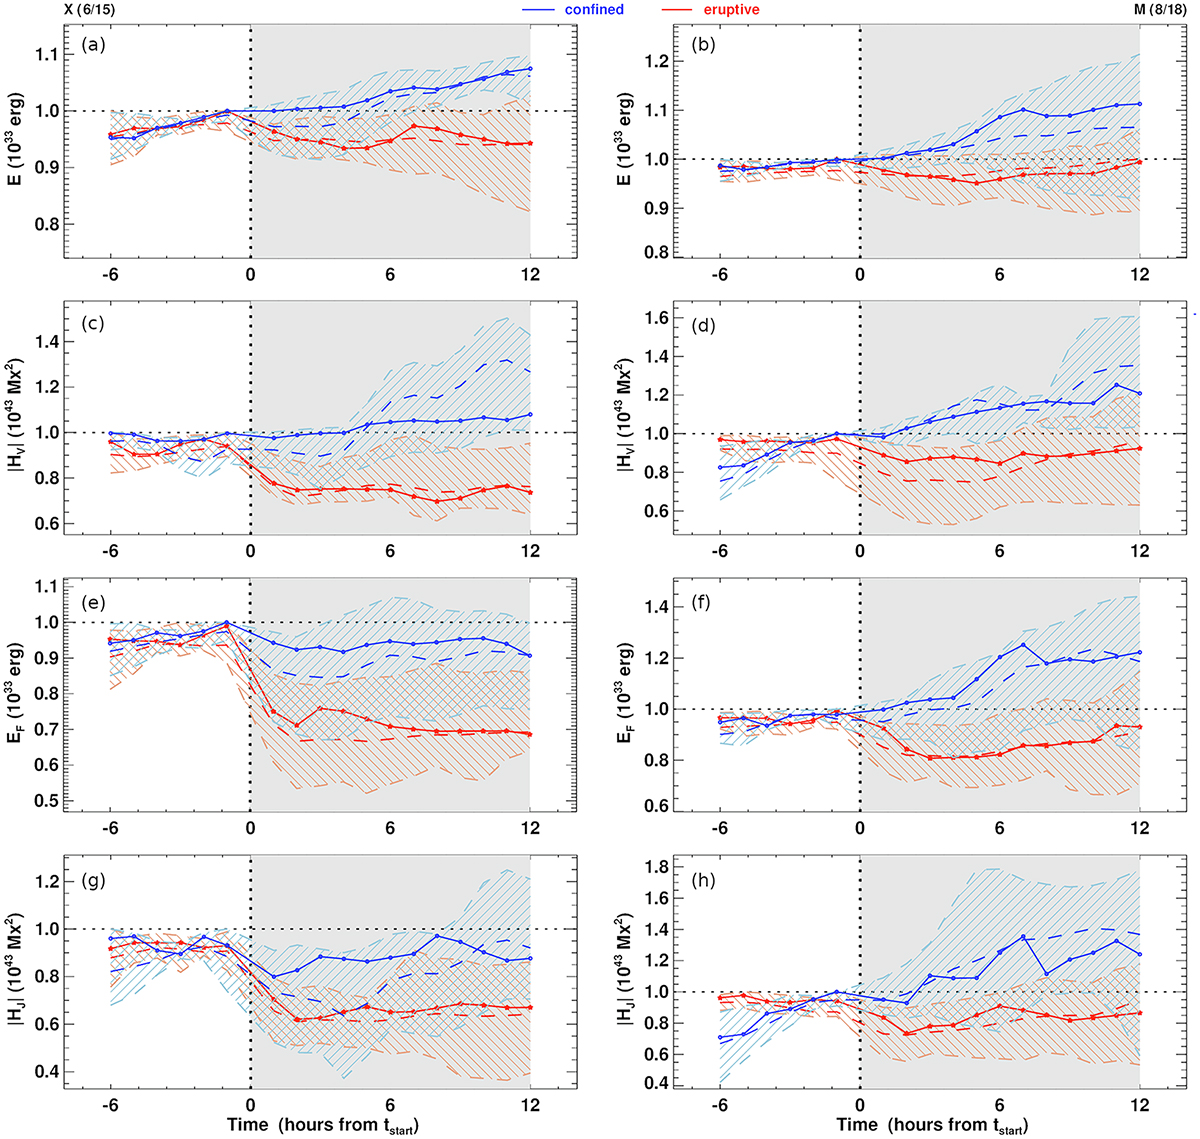
Average time evolution of selected quantities computed from the normalized (with respect to the respective preflare maximum values) superposed epoch data of event sample SX1+ (only X-class flares; left column) and for large M-class flares (GOES class M5 to M9; right column), separately for the subsets of confined (blue) and eruptive (red) flares. Numbers in brackets indicate the ratio of confined to eruptive flares within the tested sample. Covered is the time period from −6 hours to +12 hours around the flare start time (black dotted vertical line). The major-flare-less postflare time period of 12 hours used for selection of qualified events is marked by the gray-shaded area. From top to bottom in the each column the mean and median values of the total magnetic energy (E; panels (a) and (b)), total unsigned magnetic helicity (|HV|; panels (c) and (d)), free energy (EF; panels (e) and (f)), and unsigned helicity of the current-carrying field (|HJ|; panels (g) and (h)) are shown for X-class flares and large M-class flares, respectively. Dashed lines represent mean values. Solid lines connecting symbols represent median values. The shaded regimes are bound by the upper and lower quartiles of the respective distributions. Horizontal lines indicate a characteristic preflare level.
Current usage metrics show cumulative count of Article Views (full-text article views including HTML views, PDF and ePub downloads, according to the available data) and Abstracts Views on Vision4Press platform.
Data correspond to usage on the plateform after 2015. The current usage metrics is available 48-96 hours after online publication and is updated daily on week days.
Initial download of the metrics may take a while.