Open Access
Fig. 8
Download original image
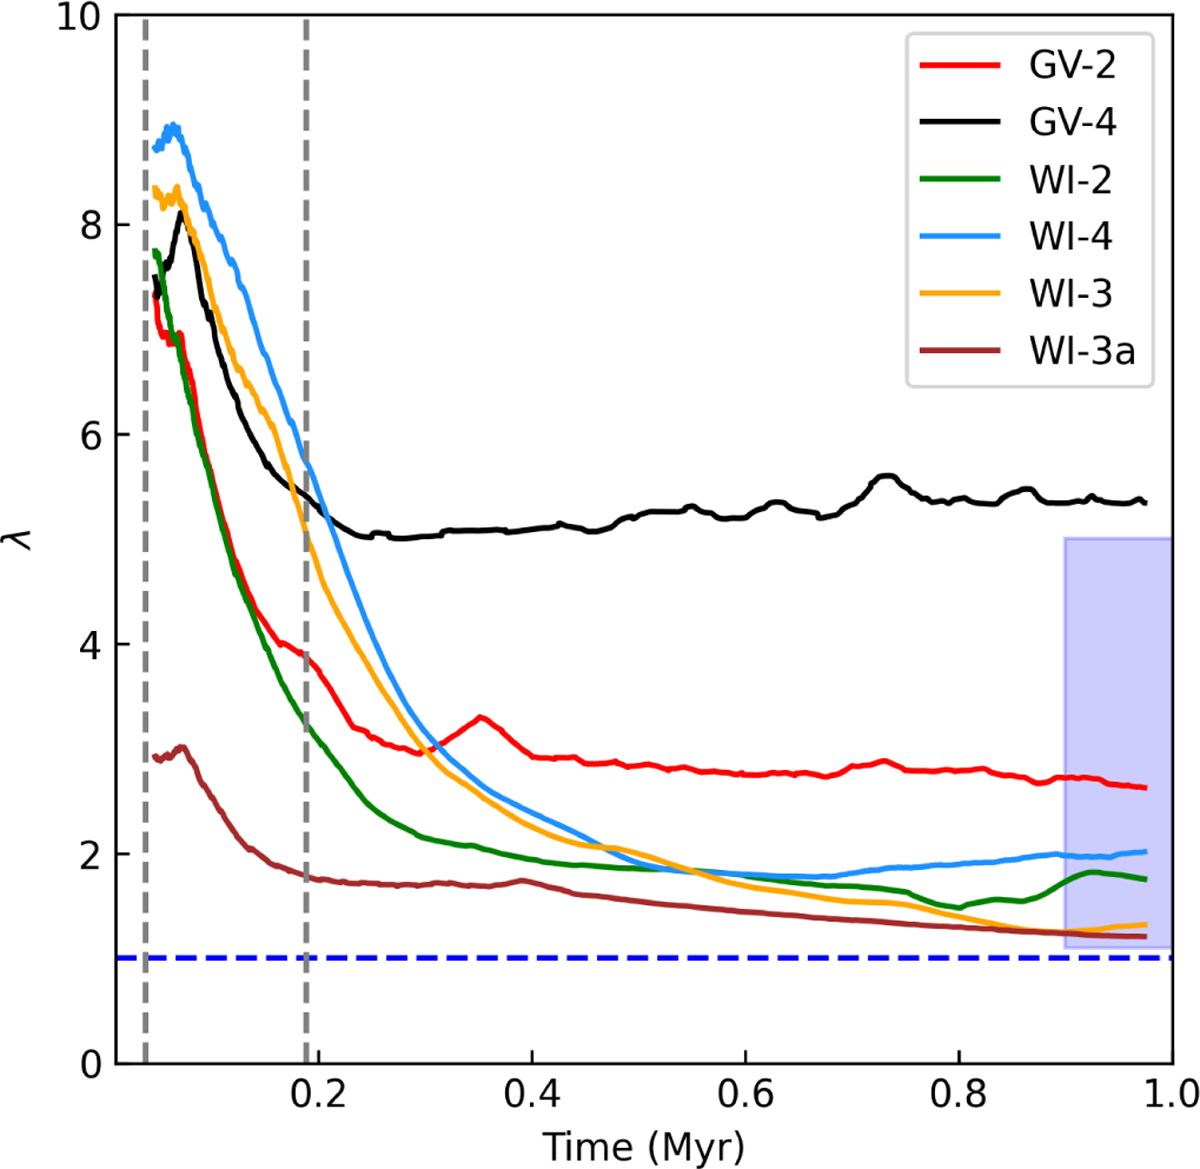
Evolution of the inferred value of the effective lever arm for the disk models. The vertical, dashed gray lines mark the average Class 0/I and Class I/II boundaries and blue, dashed line indicates lever arm length of unity. The shaded region on the right shows the expected range of values.
Current usage metrics show cumulative count of Article Views (full-text article views including HTML views, PDF and ePub downloads, according to the available data) and Abstracts Views on Vision4Press platform.
Data correspond to usage on the plateform after 2015. The current usage metrics is available 48-96 hours after online publication and is updated daily on week days.
Initial download of the metrics may take a while.