Fig. 7
Download original image
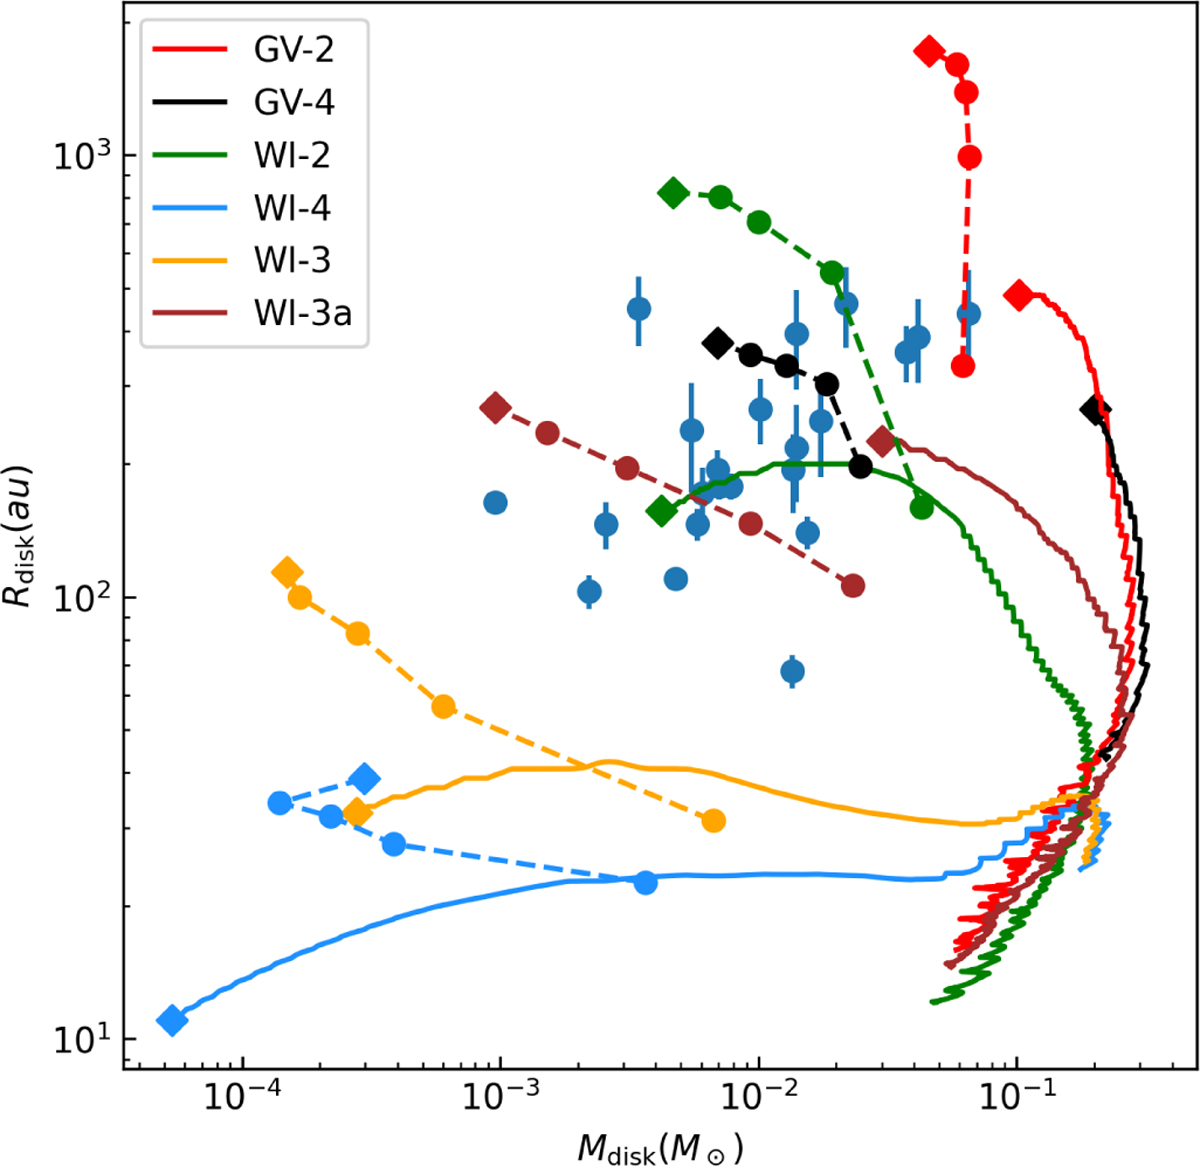
Evolution of the disk models in the mass-radius plane showing how the wind models may diverge from the gravitoviscous models after the disk achieves its maximum mass. The solid lines depict theoretical disk size, Rcf, versus gas mass within the centrifugal disk. The dashed lines show ![]() obtained from synthetic emissions versus disk mass, the latter calculated as 100 times the dust mass obtained from the synthetic continuum emission. The diamonds mark the end points at one Myr and the blue scatter plot shows observed values from an ALMA survey of the Lupus cluster (Ansdell et al. 2016; Miotello et al. 2023).
obtained from synthetic emissions versus disk mass, the latter calculated as 100 times the dust mass obtained from the synthetic continuum emission. The diamonds mark the end points at one Myr and the blue scatter plot shows observed values from an ALMA survey of the Lupus cluster (Ansdell et al. 2016; Miotello et al. 2023).
Current usage metrics show cumulative count of Article Views (full-text article views including HTML views, PDF and ePub downloads, according to the available data) and Abstracts Views on Vision4Press platform.
Data correspond to usage on the plateform after 2015. The current usage metrics is available 48-96 hours after online publication and is updated daily on week days.
Initial download of the metrics may take a while.