Fig. 6
Download original image
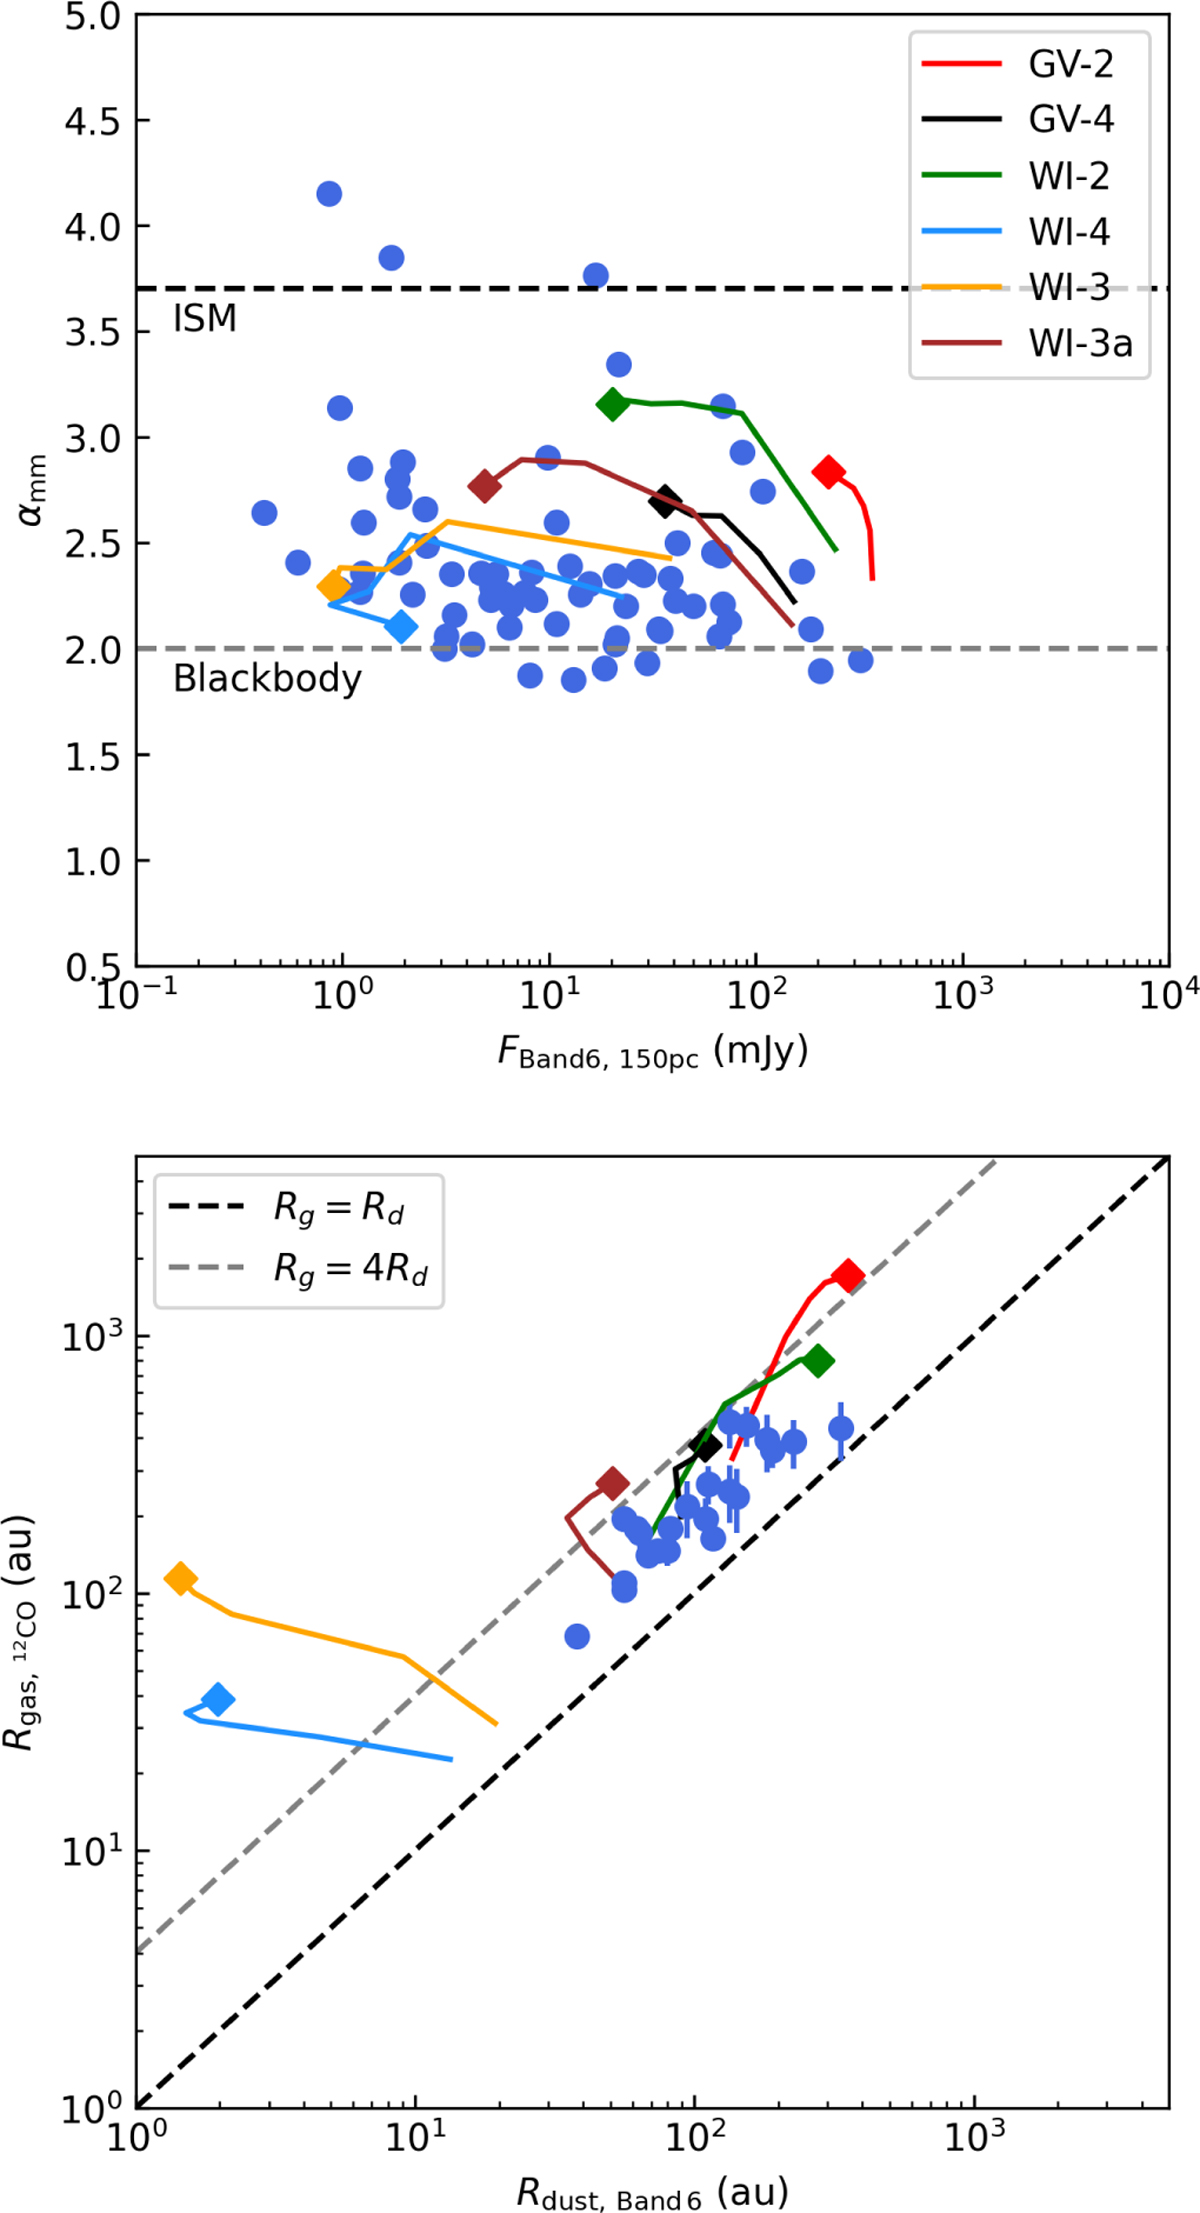
Comparison of the synthetic observations obtained from the disk models with the ALMA survey data with respect to the spectral indices (first panel) and dust-gas radii (second panel). The colored lines show evolutionary sequence of the models, starting at 0.2 Myr and ending at one Myr, with the latter point marked with a diamond. The blue scatter plots show observed quantities in Lupus cluster (Ansdell et al. 2018).
Current usage metrics show cumulative count of Article Views (full-text article views including HTML views, PDF and ePub downloads, according to the available data) and Abstracts Views on Vision4Press platform.
Data correspond to usage on the plateform after 2015. The current usage metrics is available 48-96 hours after online publication and is updated daily on week days.
Initial download of the metrics may take a while.