Fig. 5
Download original image
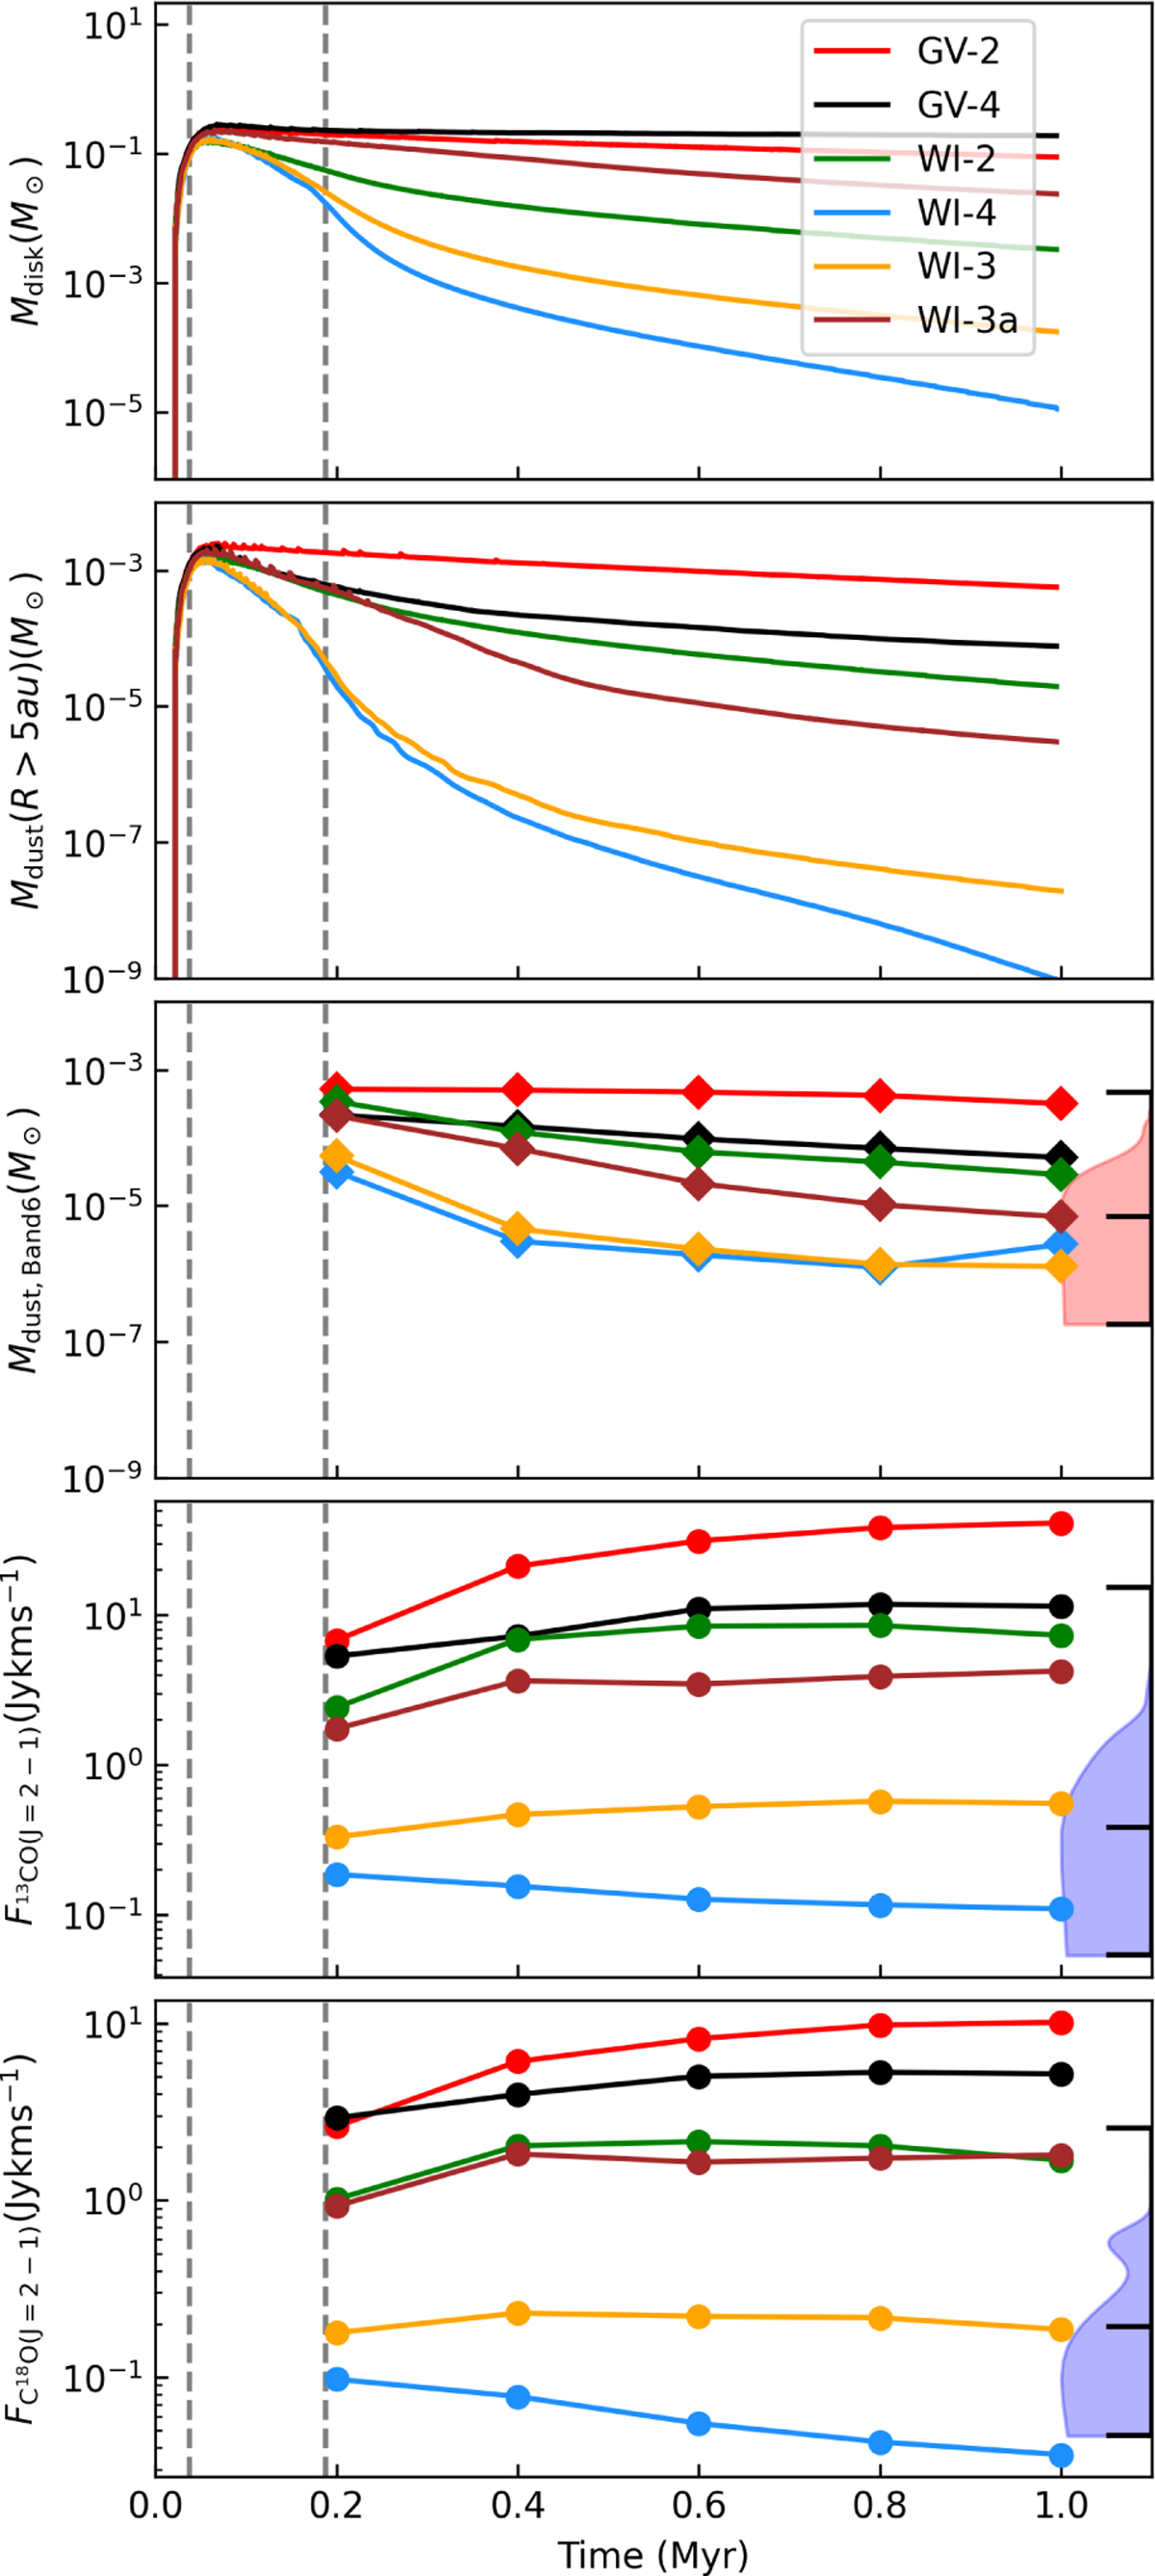
Evolution of the disk mass. Top panel: theoretical mass within the centrifugal region. Second panel: theoretical dust mass within the centrifugal disk, neglecting the innermost five au region. Third panel: Dust mass obtained from PRODIMO synthetic observations. Last two panels: synthetic CO line flux as a proxy for the disk gas content. The dust masses are calculated from continuum Band 6 fluxes, while the 13CO and C18O line fluxes are calculated at 150 pc. The vertical, dashed gray lines mark the average Class 0/I and Class I/II boundaries. The shaded regions on the right depict half-violin plots of dust masses (red) and line fluxes (blue) in Class II disks, as observed in a subset of ALMA surveys. The vertical, dashed gray lines mark the average Class 0/I and Class I/II boundaries.
Current usage metrics show cumulative count of Article Views (full-text article views including HTML views, PDF and ePub downloads, according to the available data) and Abstracts Views on Vision4Press platform.
Data correspond to usage on the plateform after 2015. The current usage metrics is available 48-96 hours after online publication and is updated daily on week days.
Initial download of the metrics may take a while.