Fig. 4
Download original image
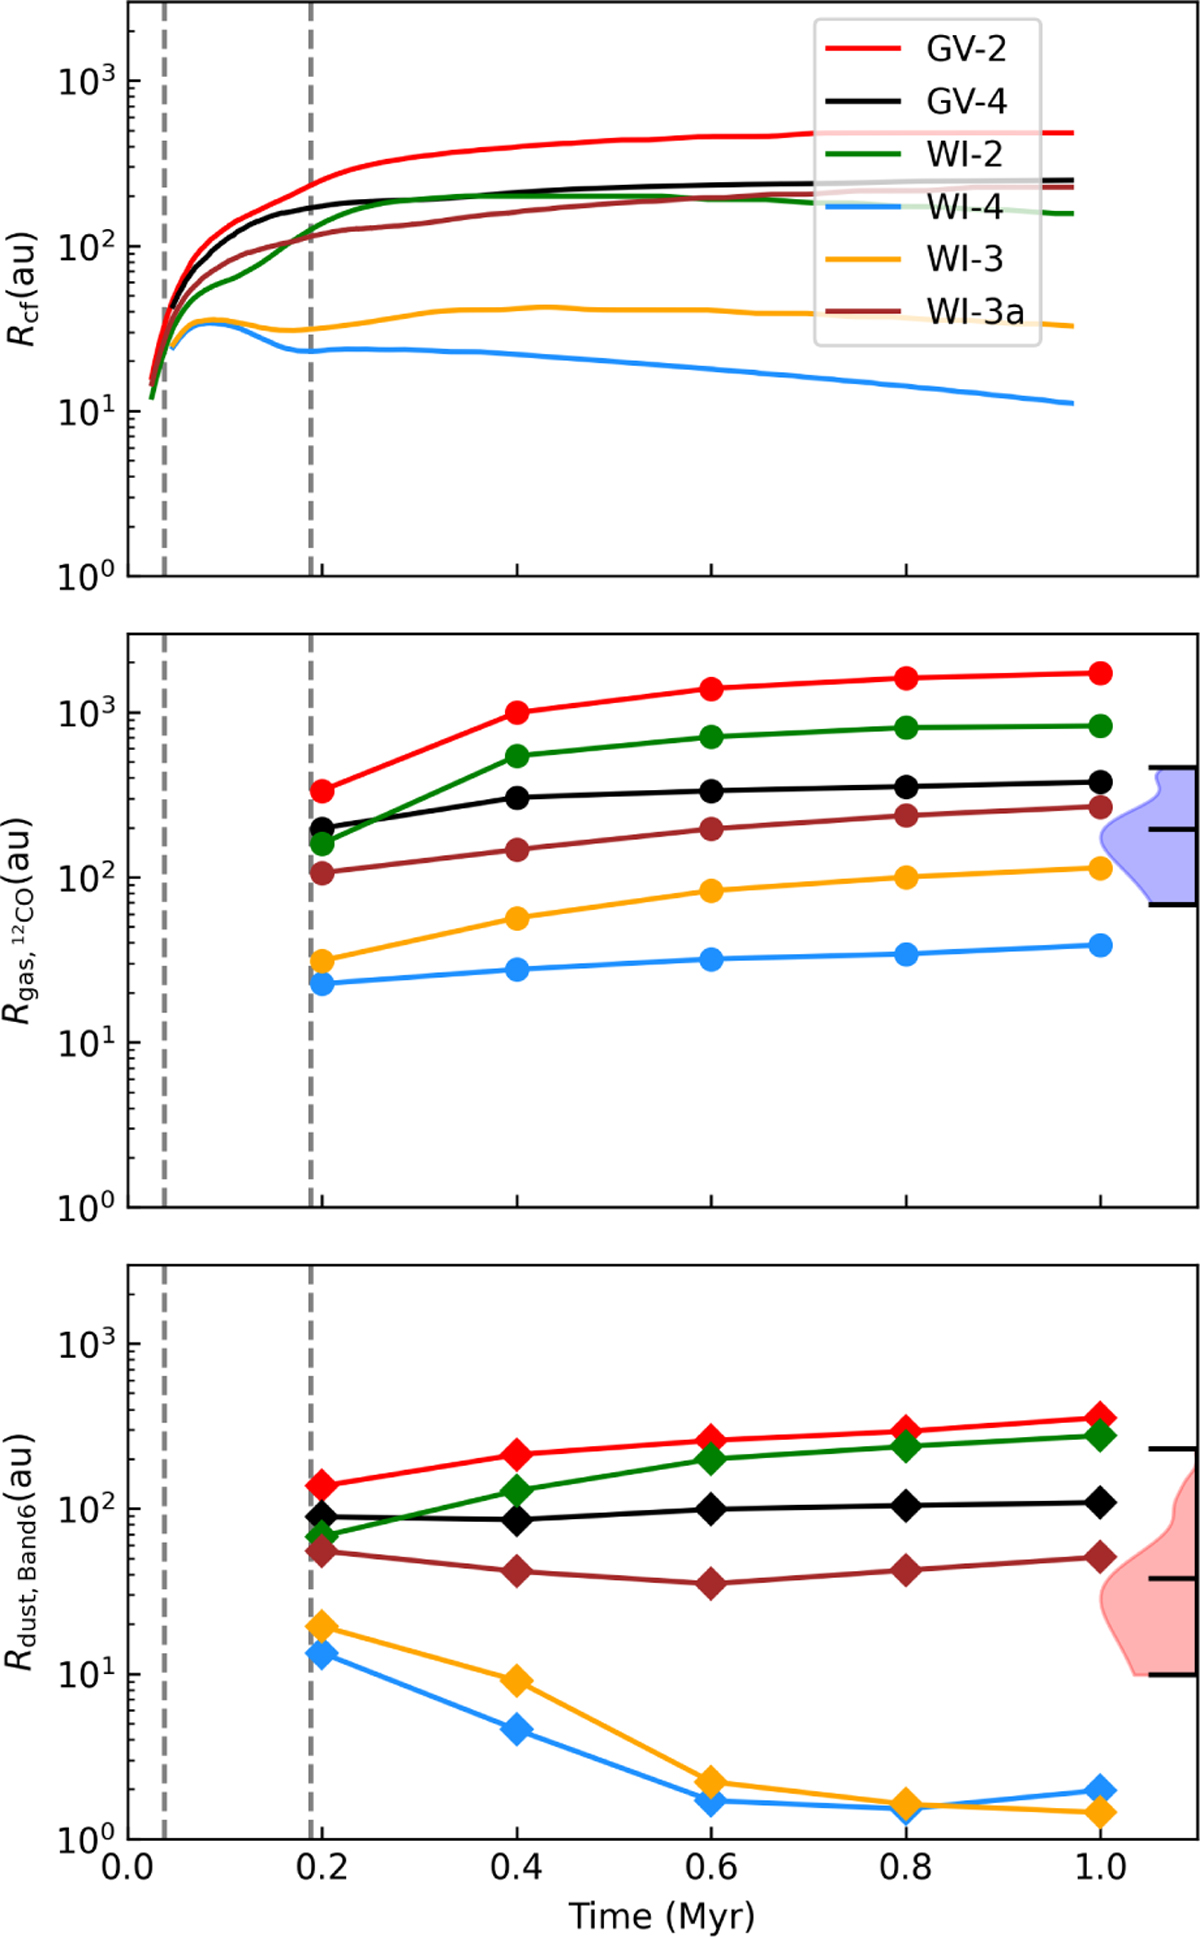
Evolution of the disk size. Top panel: theoretical centrifugal disk radii. Bottom two panels: radii obtained from PRODIMO synthetic observations . The gas and dust radii for the models are calculated via synthetic 12CO and Band 6 continuum emissions with 90% flux threshold. The vertical, dashed gray lines mark the average Class 0/I and Class I/II boundaries. The shaded regions on the right depict half-violin plots of gas (red) and dust (red) radii of the Class II disks, as observed in a subset of ALMA surveys (see Table B.1).
Current usage metrics show cumulative count of Article Views (full-text article views including HTML views, PDF and ePub downloads, according to the available data) and Abstracts Views on Vision4Press platform.
Data correspond to usage on the plateform after 2015. The current usage metrics is available 48-96 hours after online publication and is updated daily on week days.
Initial download of the metrics may take a while.