Fig. 3
Download original image
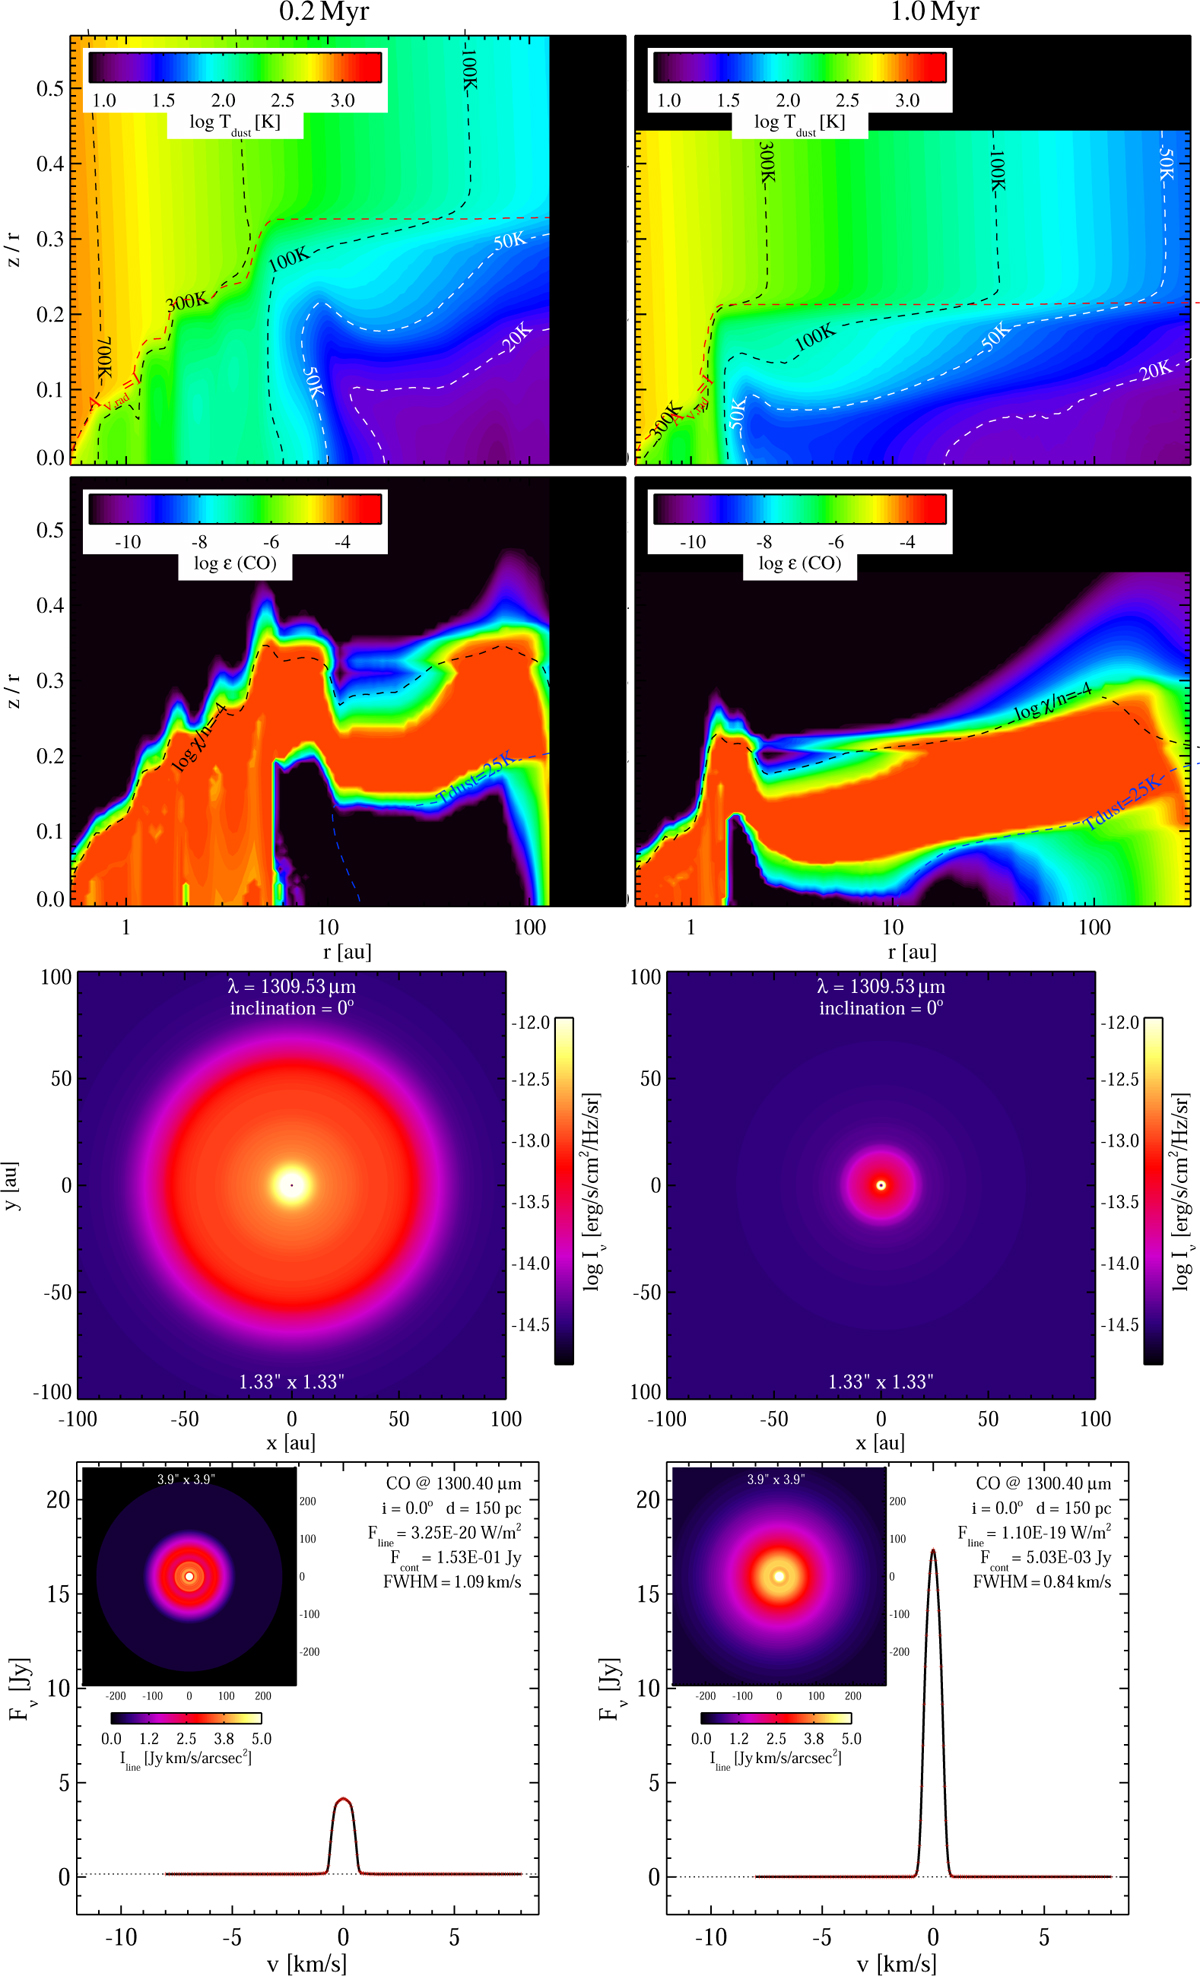
Continuation of Fig. 2 showing the dust temperature structure (top) and the CO-concentration (second row) calculated by PRODIMO based on the WI-3a model. Additional contour times show the ionization parameter χ/n (UV field strength divided by total particle density) to indicate where about the CO molecules photo-dissociate, and a dust temperature of 25 K to indicate where CO freezes out. The lower diagrams show the simulated 1.3 continuum and CO 2–1 line maps, from which we derive a continuum radius of 89 au and 109 au at 1.3 mm after 0.2 Myr and one Myr, respectively, and a disk radius in the CO 2–1 line of 198 au and 375 au, respectively. Each radius encircles 90% of the respective continuum or line flux.
Current usage metrics show cumulative count of Article Views (full-text article views including HTML views, PDF and ePub downloads, according to the available data) and Abstracts Views on Vision4Press platform.
Data correspond to usage on the plateform after 2015. The current usage metrics is available 48-96 hours after online publication and is updated daily on week days.
Initial download of the metrics may take a while.