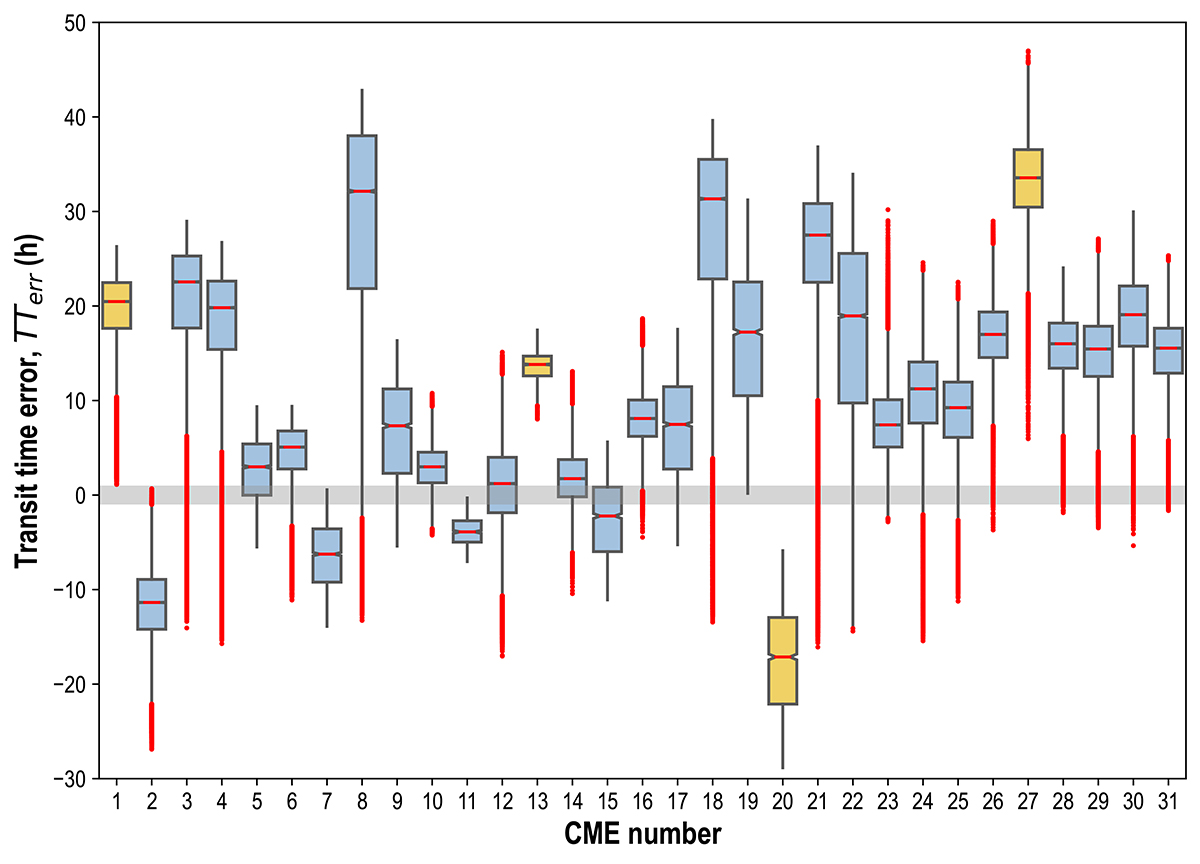
Fig. A.3.
Download original image
Transit time error (TTerr) in hours for all CME events calculated with the largest γ range (range 4) and constrained by perfect arrival speed in ±75 km s−1 window. The gray shaded area shows the interval for perfect TT (|ΔTTerr|≤1 h). Events for which an optimal γ was found are marked with blue boxes and those for which no γ was found are marked with yellow boxes. All other labels are the same as in the Figure A.2.
Current usage metrics show cumulative count of Article Views (full-text article views including HTML views, PDF and ePub downloads, according to the available data) and Abstracts Views on Vision4Press platform.
Data correspond to usage on the plateform after 2015. The current usage metrics is available 48-96 hours after online publication and is updated daily on week days.
Initial download of the metrics may take a while.