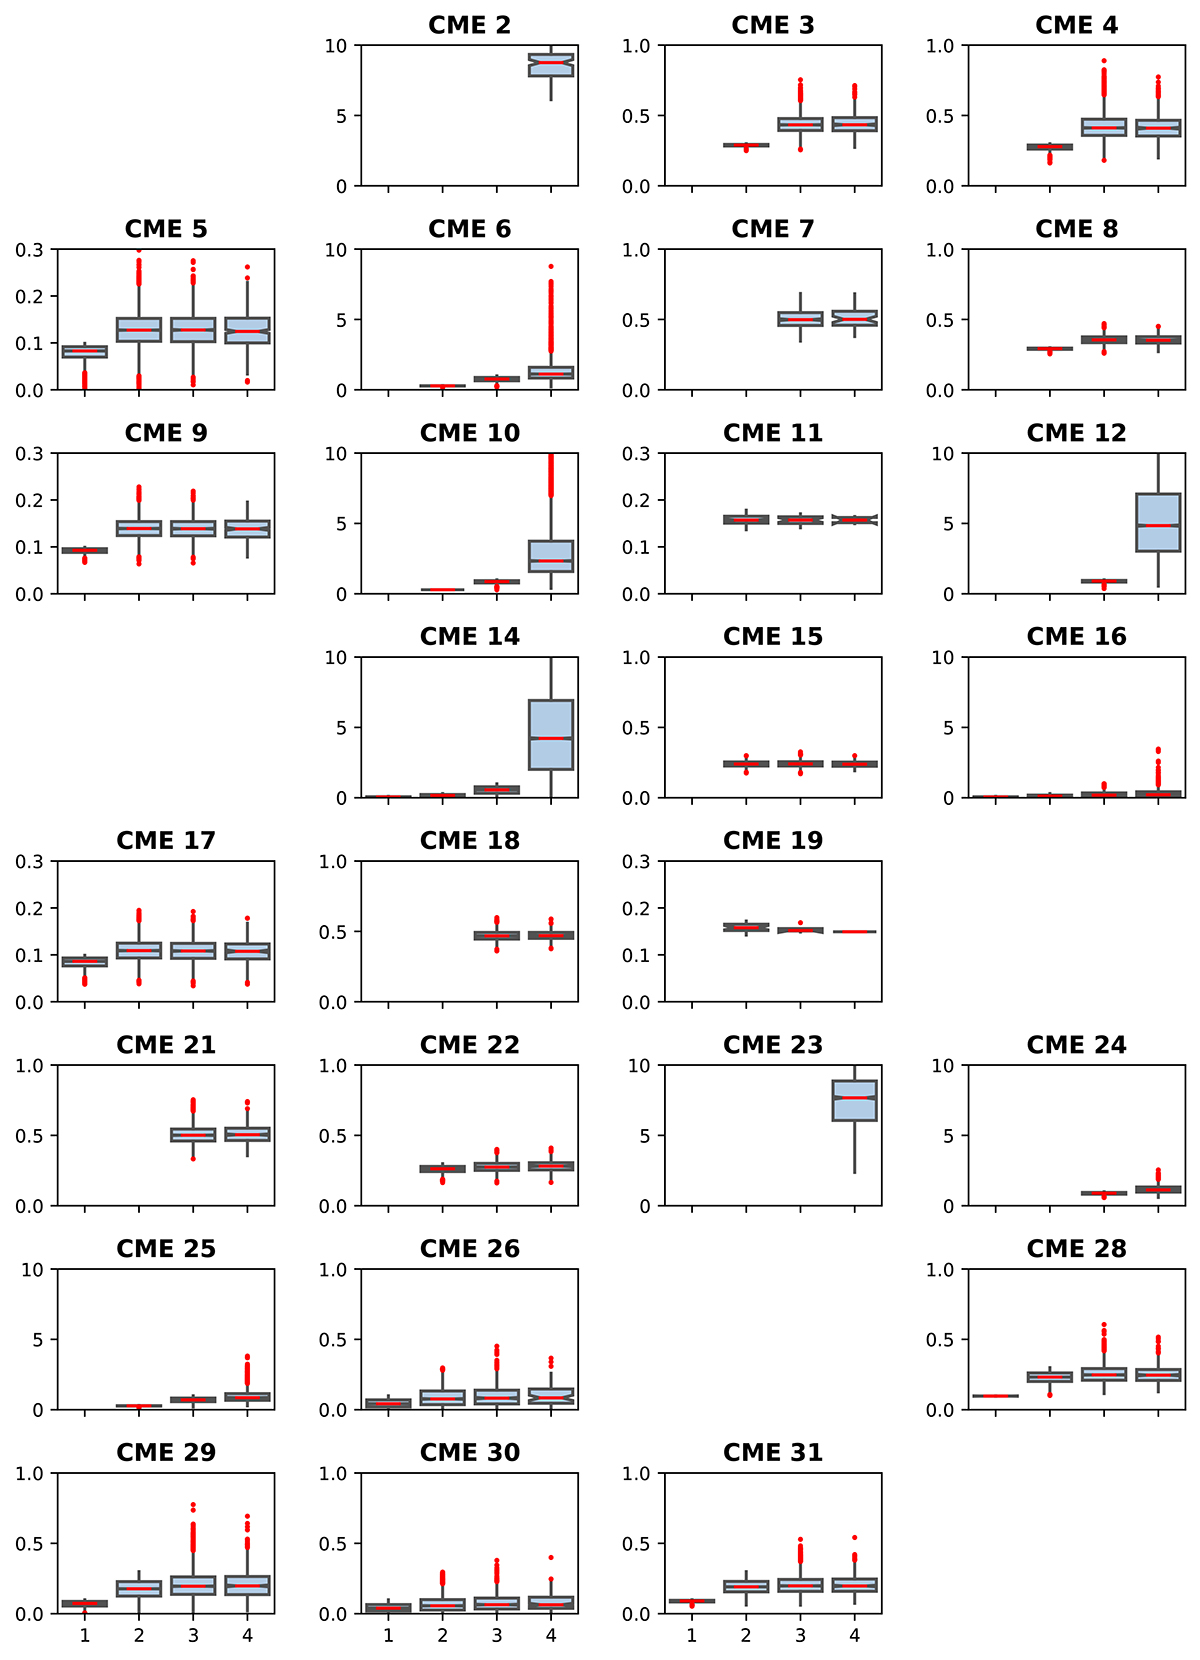
Fig. A.1.
Download original image
Dependence of the optimal γ on 4 consecutively increasing γ ranges for all events where γ is found via reverse modeling (i.e. all CMEs except CME 1, 13 , 20 and 27 where no optimal γ was found). y-axis represents the γ value in ×10−7 km−1, whereas on the x-axis four γ ranges are given: 1) 0.01–0.1, 2) 0.01–0.3, 3) 0.01–1, and 4) 0.01–10 ×10−7 km−1. The boxes denote the interquartile range (IQR) limited by the 1st quartile (Q1: 25th percentile) and the 3rd quartile (Q3: 75th percentile), where 50% of the data are found. The median is represented by a red line, and the notches show the 95% confidence interval of the median. Whisker ranges define minimum and maximum values, defined as Q1 − 1.5 * IQR and Q3 + 1.5 * IQR, respectively. Outliers are marked with the red dots.
Current usage metrics show cumulative count of Article Views (full-text article views including HTML views, PDF and ePub downloads, according to the available data) and Abstracts Views on Vision4Press platform.
Data correspond to usage on the plateform after 2015. The current usage metrics is available 48-96 hours after online publication and is updated daily on week days.
Initial download of the metrics may take a while.