Open Access
Fig. 4.
Download original image
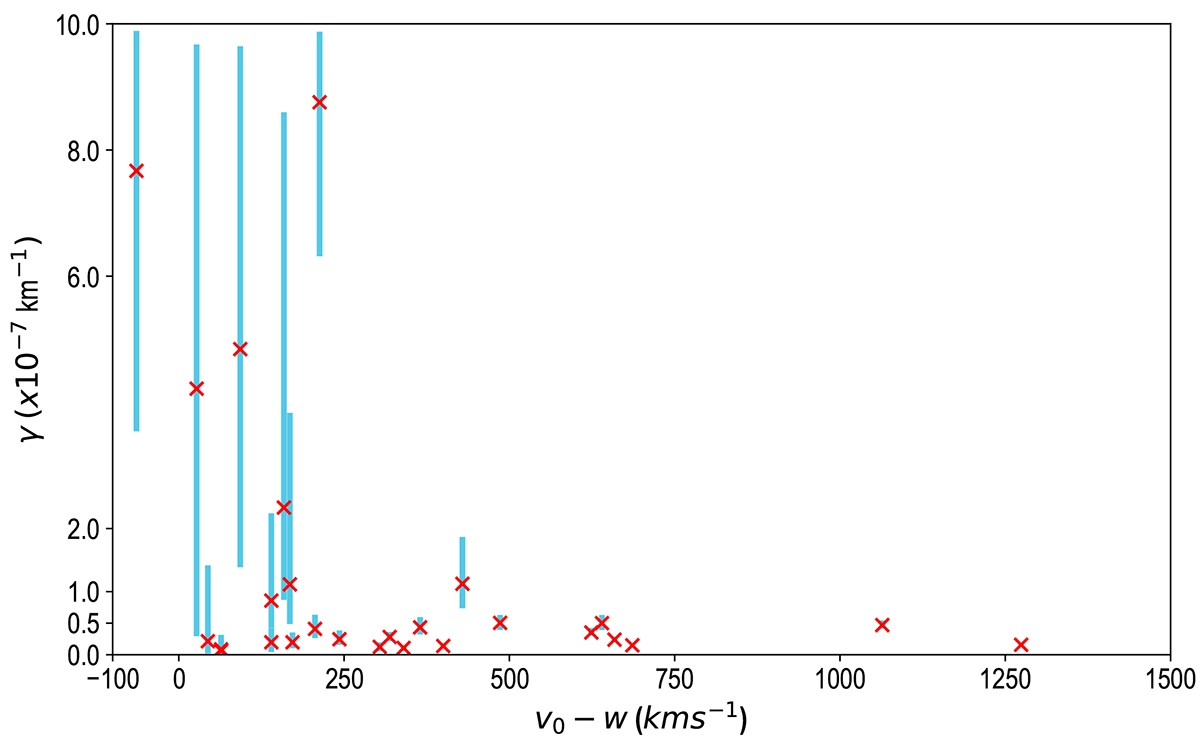
Dependence of optimal γ found on the difference between CME launch speed and solar-wind speed (v0 − w). The red crosses denote the median of the γ values, and the blue bars show the 95th percentile intervals.
Current usage metrics show cumulative count of Article Views (full-text article views including HTML views, PDF and ePub downloads, according to the available data) and Abstracts Views on Vision4Press platform.
Data correspond to usage on the plateform after 2015. The current usage metrics is available 48-96 hours after online publication and is updated daily on week days.
Initial download of the metrics may take a while.