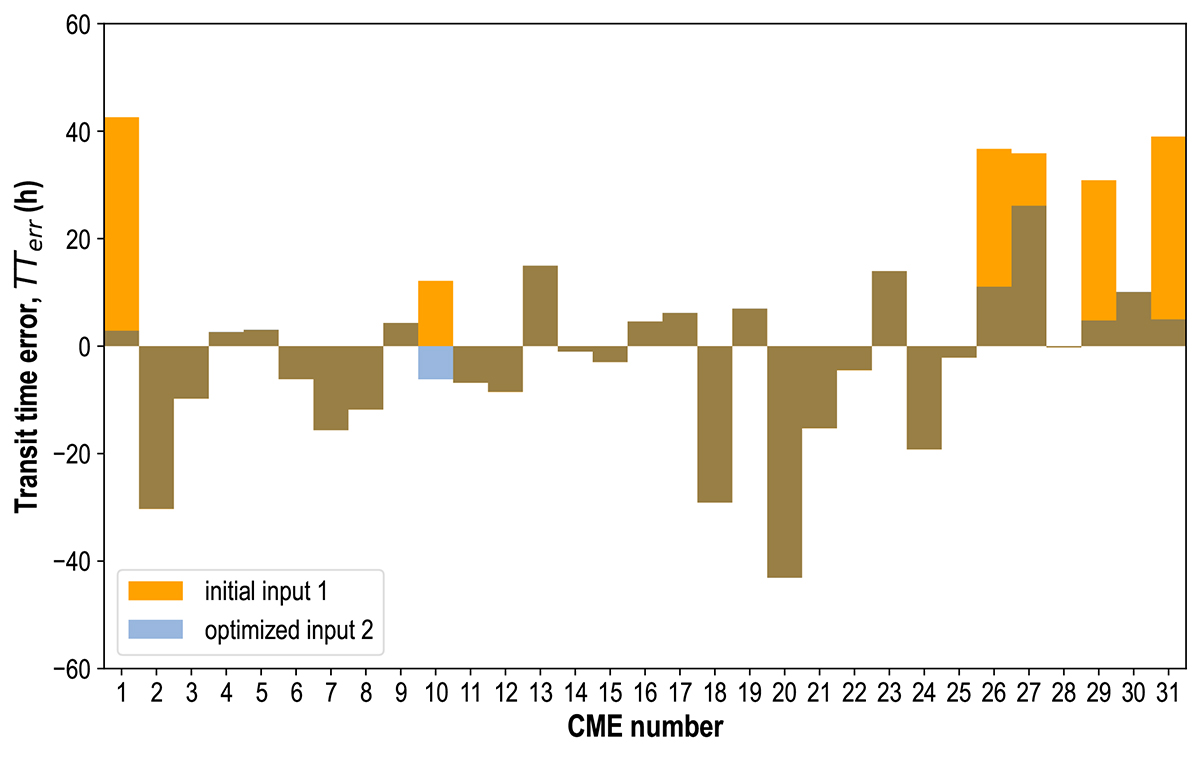
Fig. 2.
Download original image
Transit-time error (TTerr) in hours for the initial input (orange bars) and after changing input for specific events (light blue bars) for all 31 CMEs analyzed. Regions where TTerr overlaps for the two cases are marked in dark green (orange + blue = dark green). We note that for events where input was not changed, the overlap is 100%.
Current usage metrics show cumulative count of Article Views (full-text article views including HTML views, PDF and ePub downloads, according to the available data) and Abstracts Views on Vision4Press platform.
Data correspond to usage on the plateform after 2015. The current usage metrics is available 48-96 hours after online publication and is updated daily on week days.
Initial download of the metrics may take a while.