Fig. 1.
Download original image
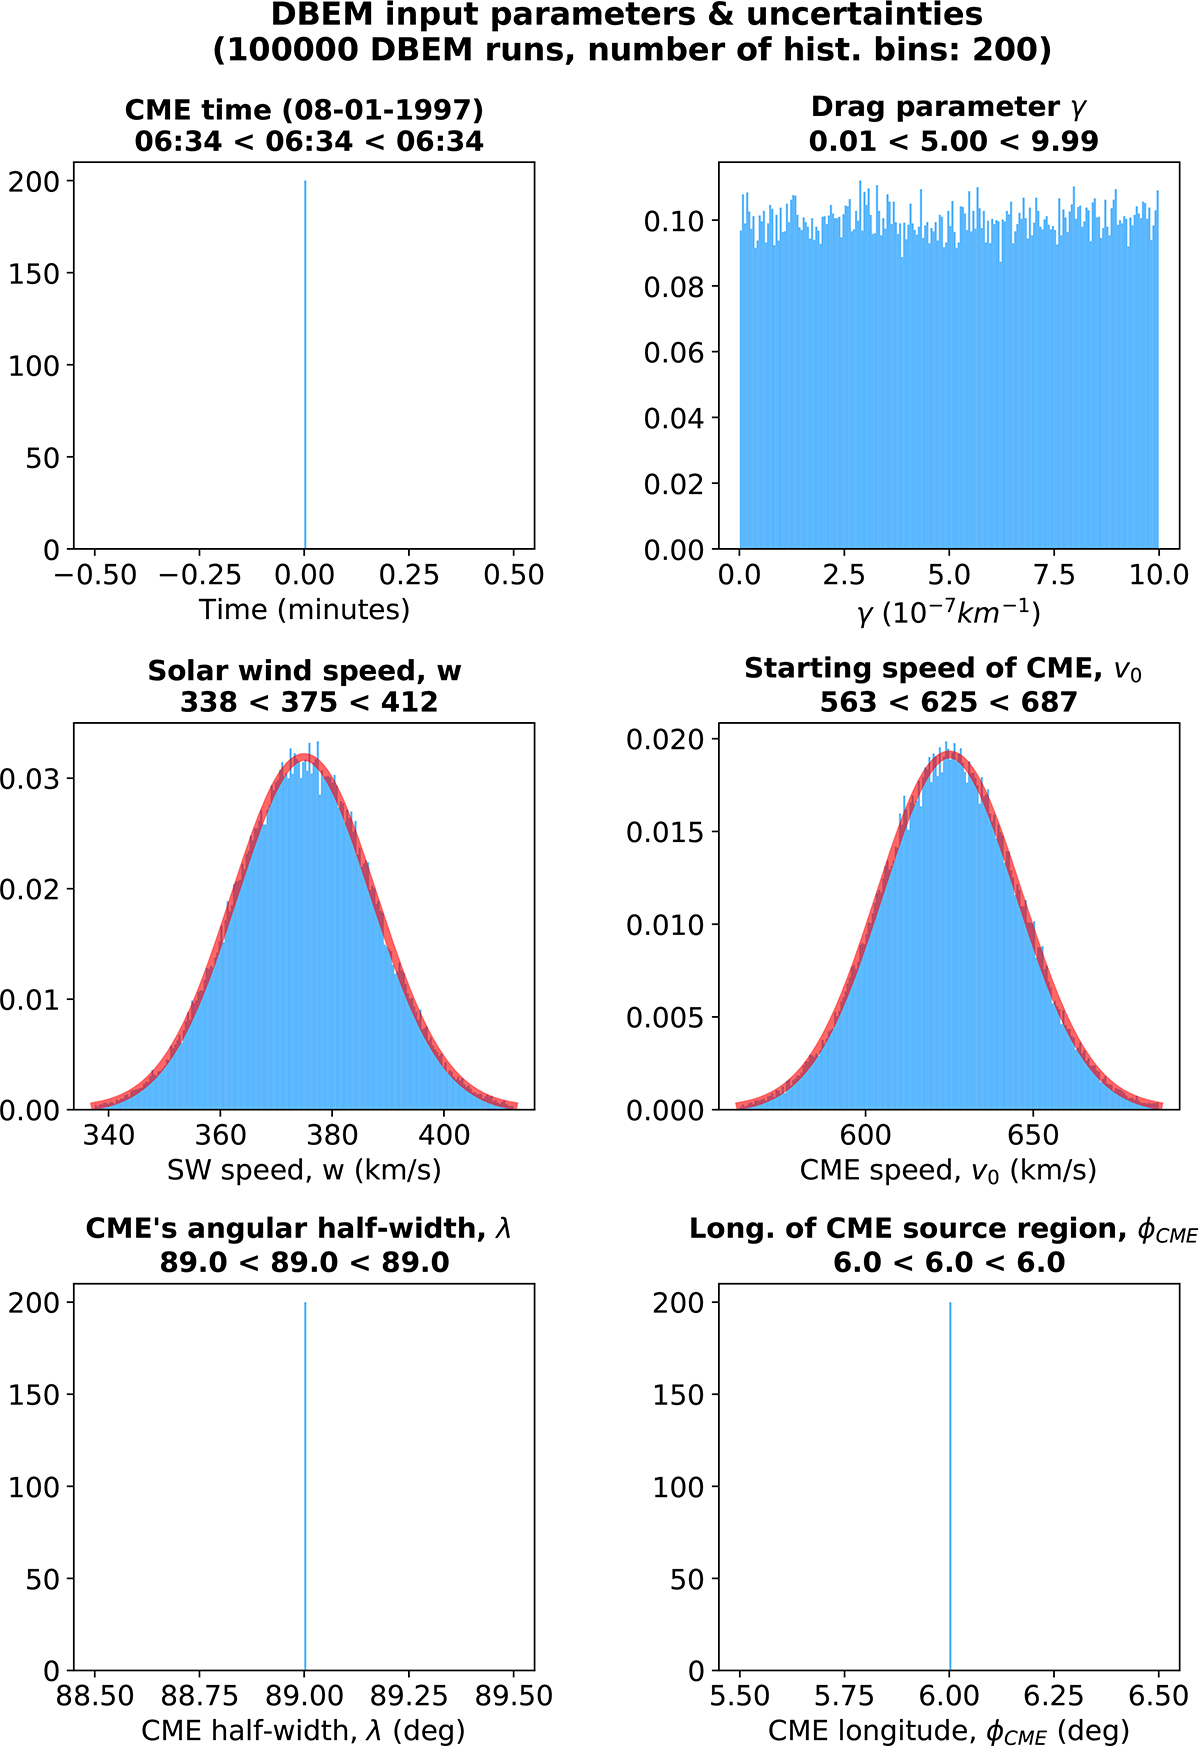
Example of six DBEM input parameters with their corresponding uncertainties used in reverse modeling plotted in histograms (y-axis is density) as probability-density functions (PDFs) for the first event (January 8, 1997) from the analyzed CME list. The given uncertainties (99.7% confidence intervals or 3σ) are given above each plot (lower uncertainty < input value < upper uncertainty). The solid red line indicates the calculated normal distribution. Since the CME time, the angular half-width, and longitude of CME source position are set without the uncertainties, they are shown in the histograms as just a vertical line. In the reverse-modeling scheme, we allow all γ values with equal probability (no weight is applied); thus, the γ has continuous uniform distribution.
Current usage metrics show cumulative count of Article Views (full-text article views including HTML views, PDF and ePub downloads, according to the available data) and Abstracts Views on Vision4Press platform.
Data correspond to usage on the plateform after 2015. The current usage metrics is available 48-96 hours after online publication and is updated daily on week days.
Initial download of the metrics may take a while.