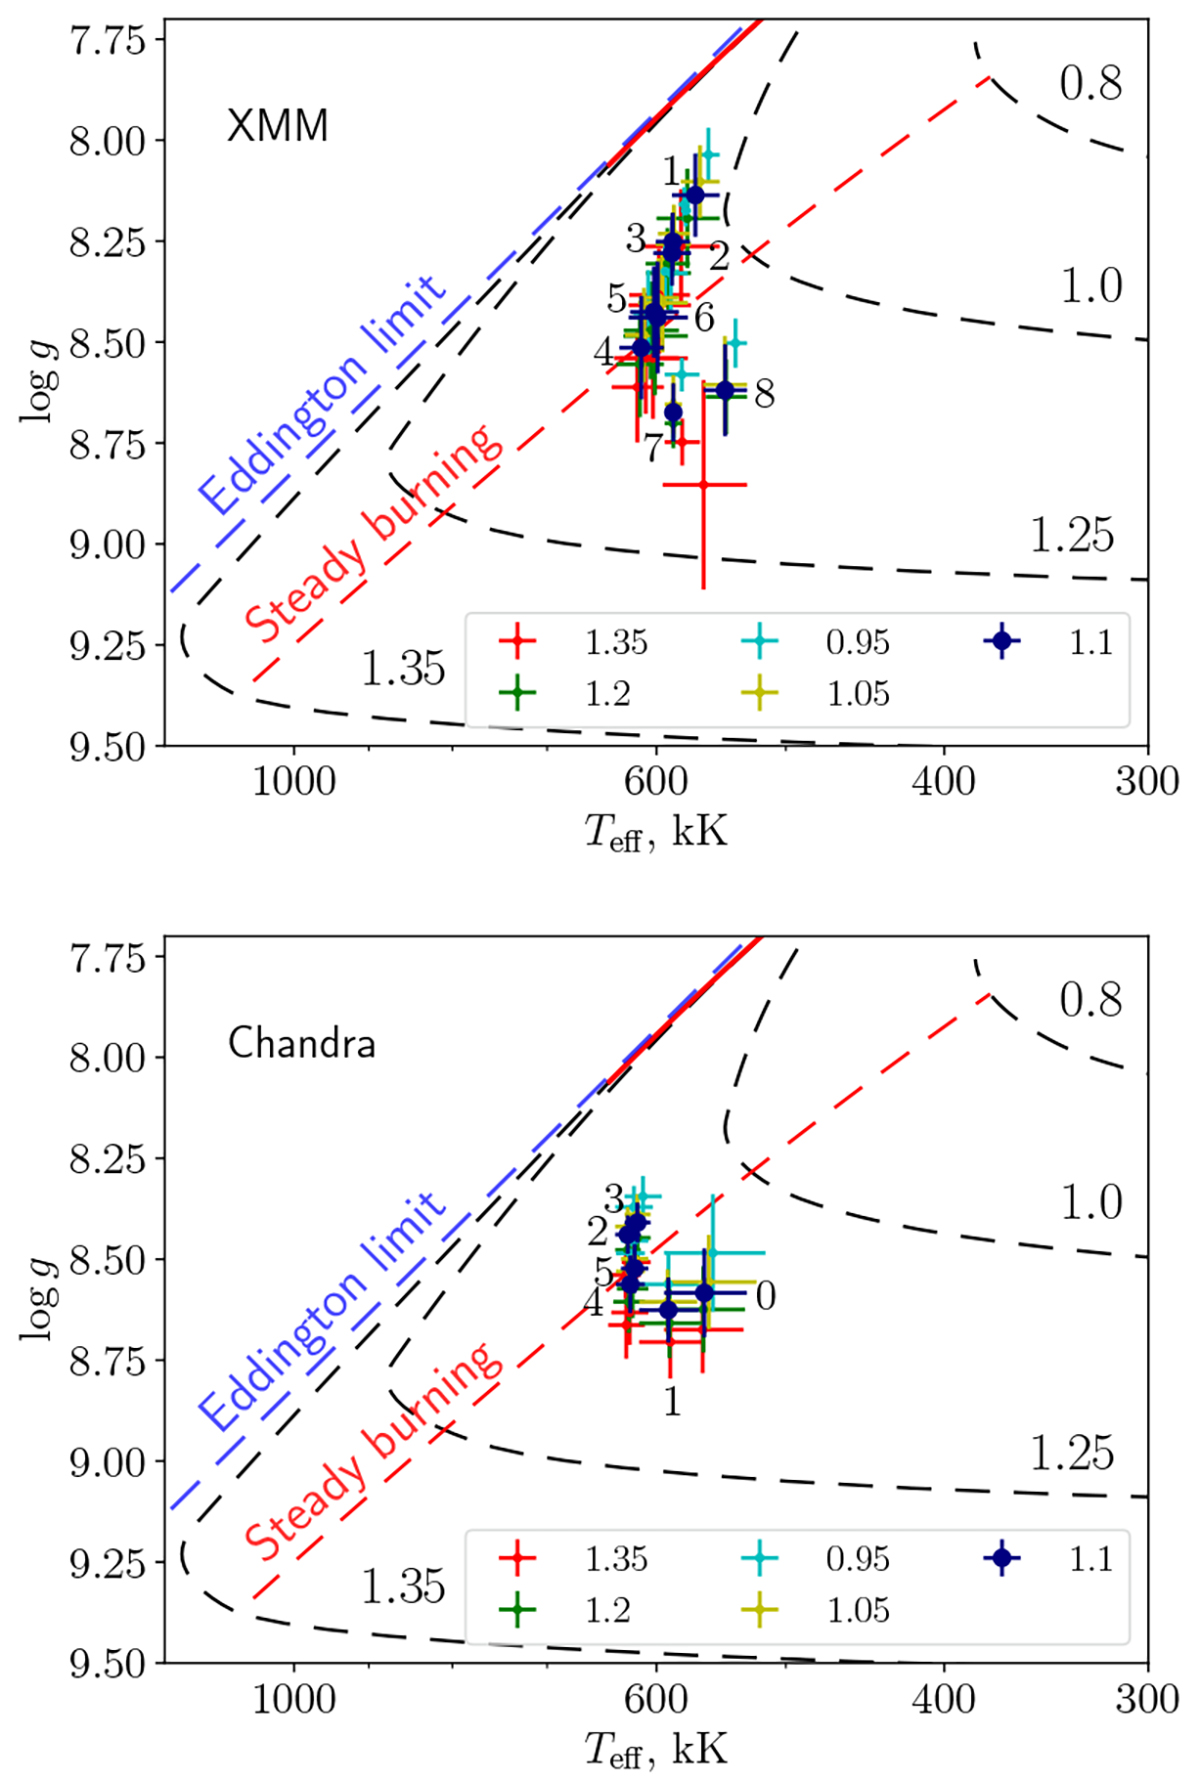
Fig. 1.
Download original image
Positions of the source in the Teff − log g plane according to different XMM-Newton (upper panel) and Chandra (lower panel) observations (see Tables 3 and 4). The WD mass was fixed, and different colours indicate different masses from 0.95 to 1.35 M⊙. For clarity, only a portion of the mass range is shown. The fits with M = 1.1 M⊙ are additionally indicated by the increased marker size. Model dependencies for various WD masses, taken from Nomoto et al. (2007), are shown by black dashed curves. The numbers at the curves indicate WD masses (in solar masses). The lower boundary of the stable thermonuclear burning band is shown by the dashed red line. The Eddington limit for solar H/He abundances is shown by the blue dashed line. The numbers denote the spectrum number (see Sect. 2).
Current usage metrics show cumulative count of Article Views (full-text article views including HTML views, PDF and ePub downloads, according to the available data) and Abstracts Views on Vision4Press platform.
Data correspond to usage on the plateform after 2015. The current usage metrics is available 48-96 hours after online publication and is updated daily on week days.
Initial download of the metrics may take a while.