Fig. J.1
Download original image
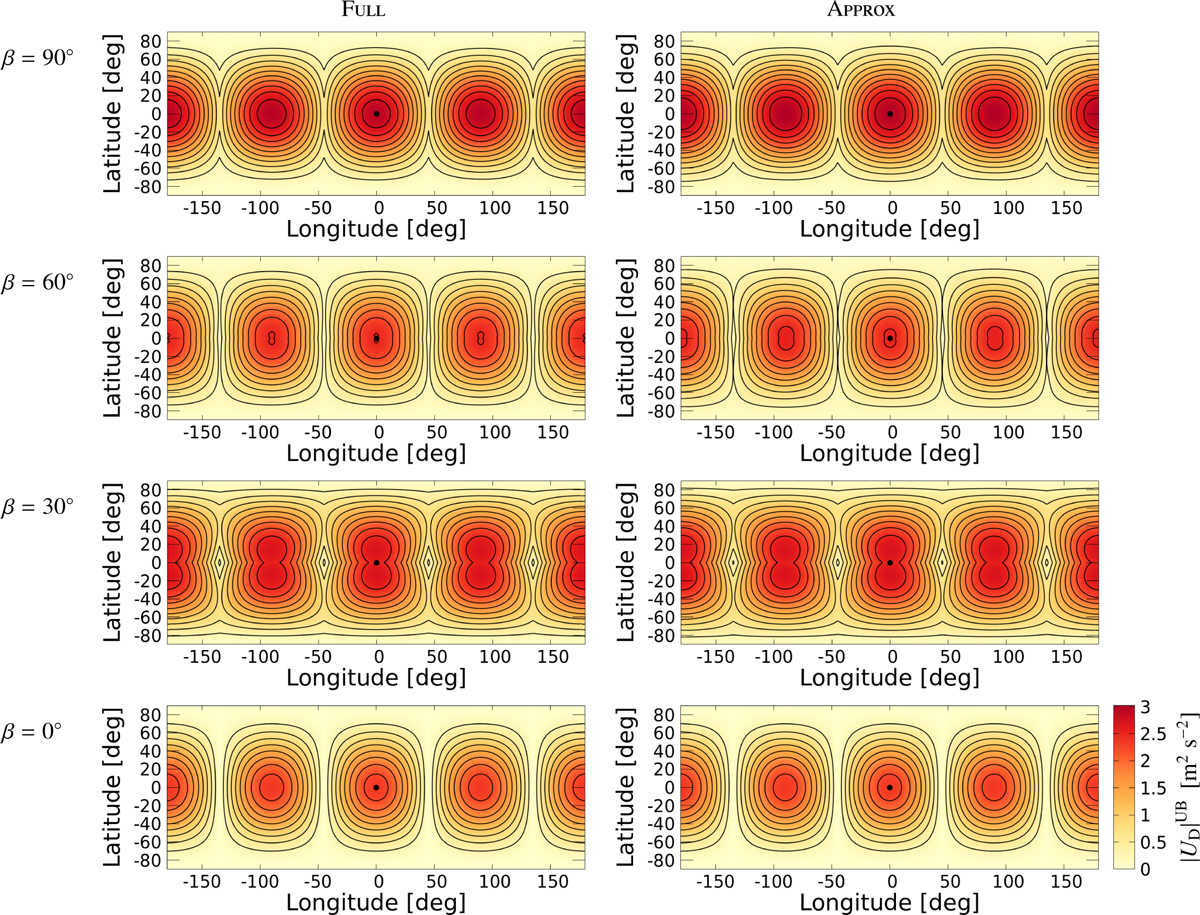
Gravitational potential induced by the tidal response of an ocean planet with deformable solid regions in the system of coordinates rotating with the perturber for Prot = 10 hr and obliquity values ranging between 0° and 90°. Left: maximum amplitude of the tidal potential obtained from the full calculation (FULL). Right: maximum amplitude of the tidal potential obtained with the standard approximation based on the equatorial degree-2 Love number (APPROX). Amplitudes are plotted as functions of longitude, ![]() (horizontal axis), and latitude,
(horizontal axis), and latitude, ![]() (vertical axis). Red areas indicate large amplitudes, and yellow areas small amplitudes. The black dot at
(vertical axis). Red areas indicate large amplitudes, and yellow areas small amplitudes. The black dot at ![]() designates the sub-satellite point.
designates the sub-satellite point.
Current usage metrics show cumulative count of Article Views (full-text article views including HTML views, PDF and ePub downloads, according to the available data) and Abstracts Views on Vision4Press platform.
Data correspond to usage on the plateform after 2015. The current usage metrics is available 48-96 hours after online publication and is updated daily on week days.
Initial download of the metrics may take a while.