Fig. 4.
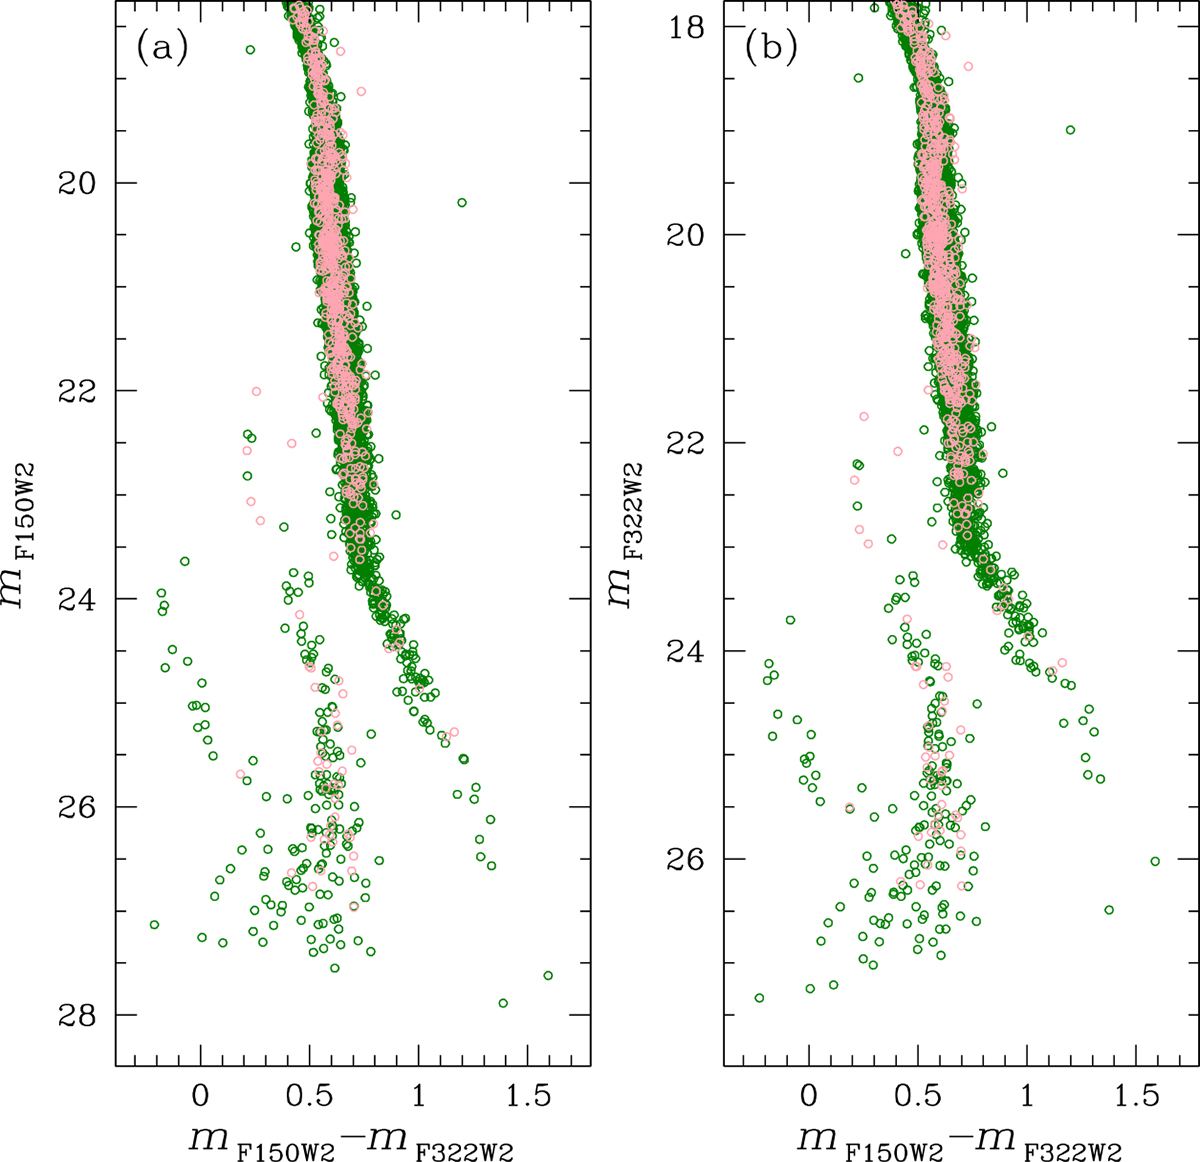
Download original image
Color-magnitude diagrams in overlapping regions. (a) mF150W2 versus mF150W2 − mF322W2 CMD for the selected sample of stars, with green circles representing stars located in the region of overlap between the two GO-2559 epochs, and magenta circles indicating stars in the overlap region between GO-2559 v123 and GO-2560 v2. (b) Same as (a), but for the mF322W2 versus mF150W2 − mF322W2 CMD.
Current usage metrics show cumulative count of Article Views (full-text article views including HTML views, PDF and ePub downloads, according to the available data) and Abstracts Views on Vision4Press platform.
Data correspond to usage on the plateform after 2015. The current usage metrics is available 48-96 hours after online publication and is updated daily on week days.
Initial download of the metrics may take a while.