Fig. 5
Download original image
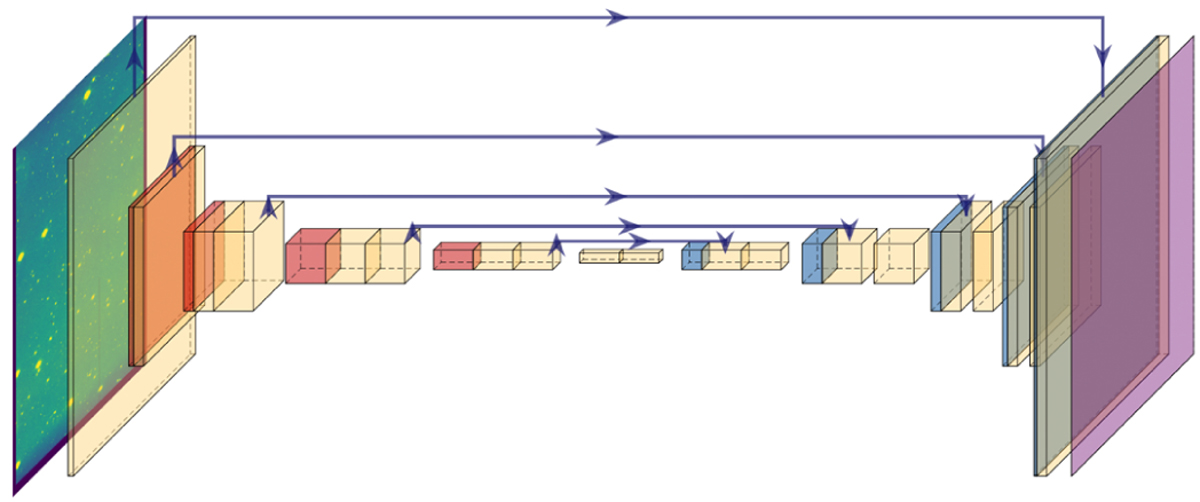
Schematic of the TernausNet architecture and the transformations performed on the input image (left). Yellow blocks represent convolutions and transpose convolutions, while red and blue blocks depict max-pooling and unpooling, respectively. The arrows from the encoder (first half) to the decoder (second half) show skip connections, which connect non-adjacent layers and enhance the performance of the network. The thickness of the blocks is proportional to the number of channels after the transformation; the input image has three (RGB) and the sigmoid output has one. The height of the blocks relates to the relative map size after the transformation. Adapted from Iglovikov & Shvets (2018).
Current usage metrics show cumulative count of Article Views (full-text article views including HTML views, PDF and ePub downloads, according to the available data) and Abstracts Views on Vision4Press platform.
Data correspond to usage on the plateform after 2015. The current usage metrics is available 48-96 hours after online publication and is updated daily on week days.
Initial download of the metrics may take a while.