Fig. A.1.
Download original image
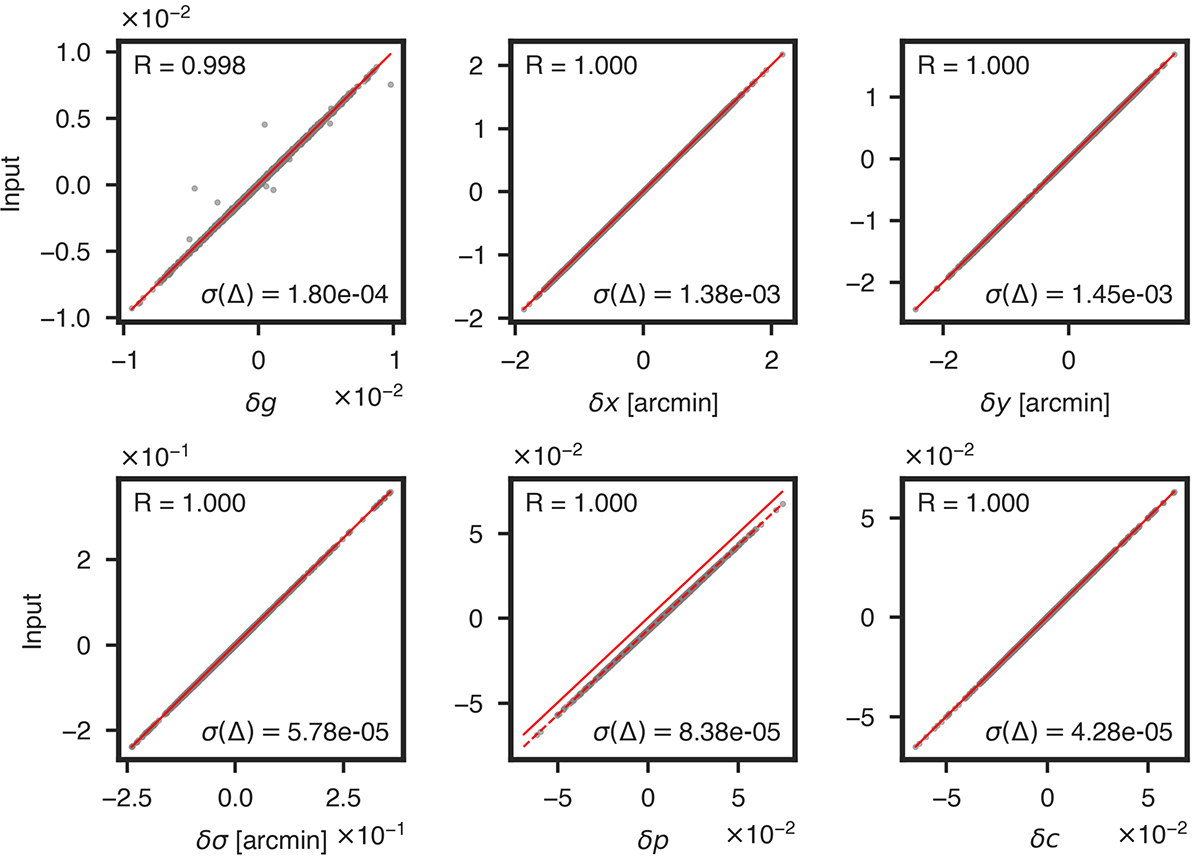
Scatter plot of the recovered beam mismatch parameters averaged over time trunks (x-axis) vs. the input values (y-axis) for all 1728 detector pairs of a simulation at 150 GHz. The red solid curves have a slope of 1 and a y-intercept of 0. The red dashed curve has been offset vertically by the mean bias on δp estimated from systematics-free simulations. The correlation coefficient R and the standard deviation of the bias on the deprojection coefficient σ(Δ) are exhibited.
Current usage metrics show cumulative count of Article Views (full-text article views including HTML views, PDF and ePub downloads, according to the available data) and Abstracts Views on Vision4Press platform.
Data correspond to usage on the plateform after 2015. The current usage metrics is available 48-96 hours after online publication and is updated daily on week days.
Initial download of the metrics may take a while.