Open Access
Fig. 4.
Download original image
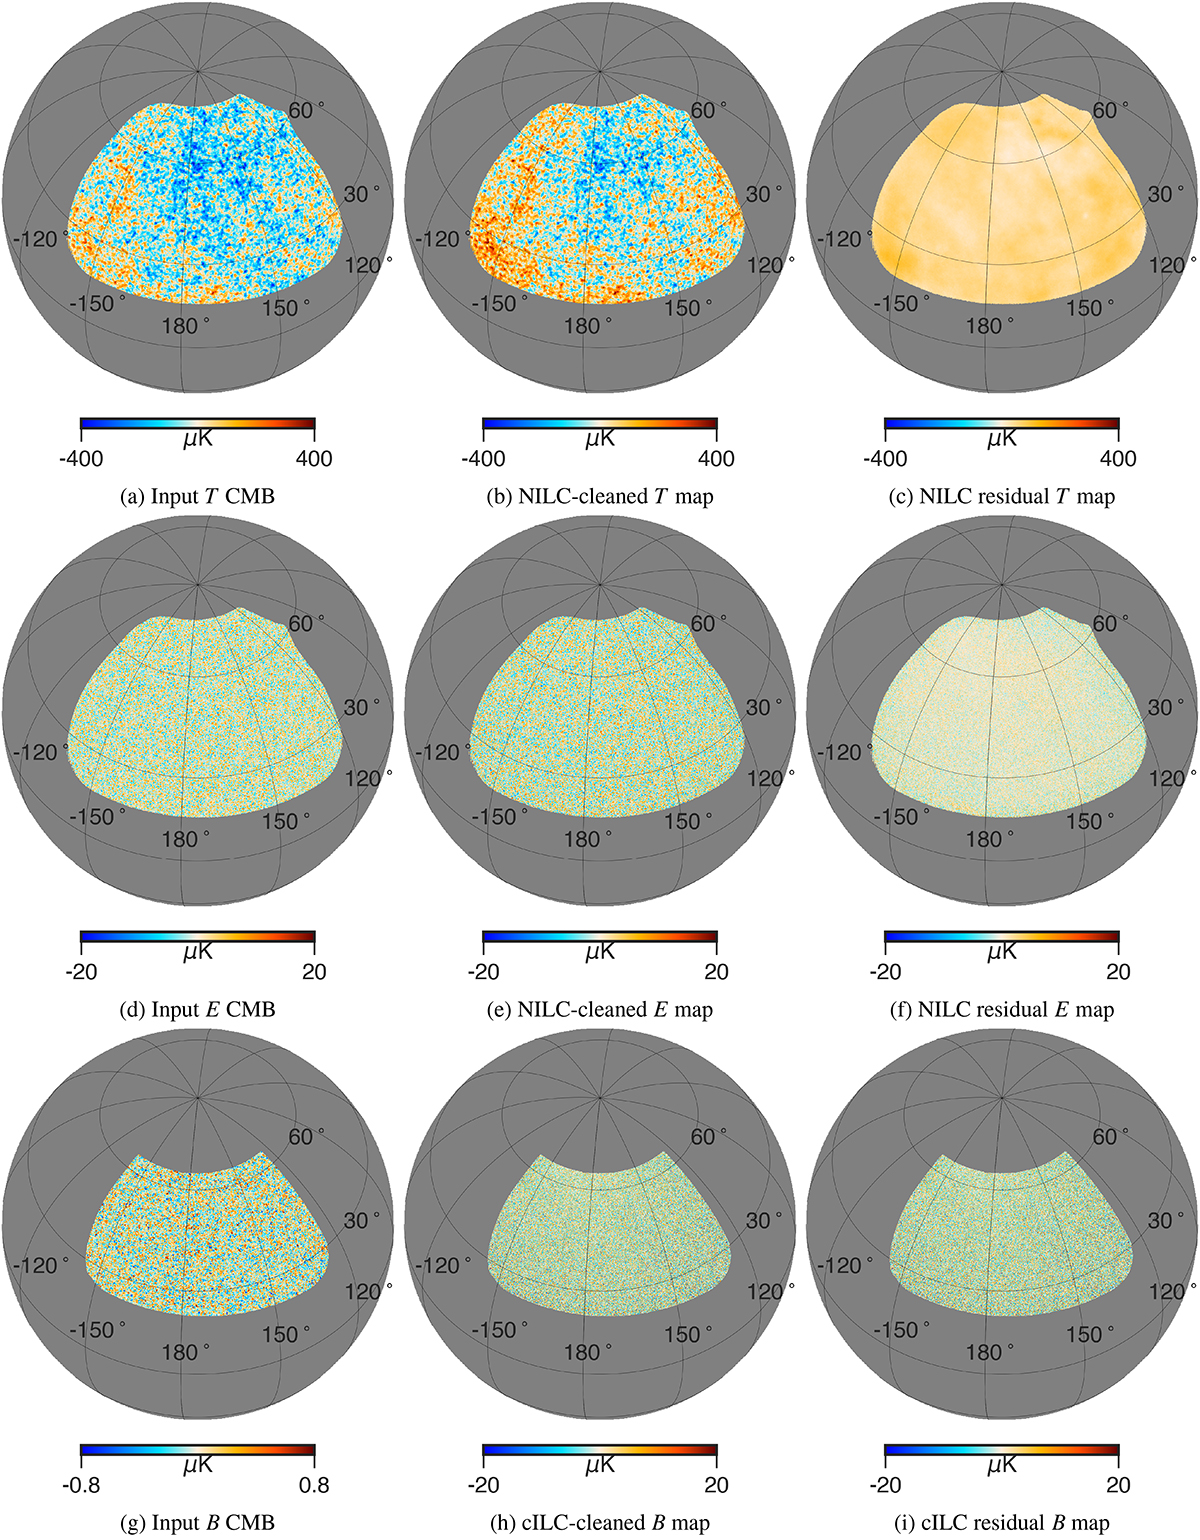
Maps of the input CMB (left column), the foreground-cleaned maps (middle column), and their difference, i.e., the residual maps (right column) for the T, E, and B modes. The first row shows T maps, the second row shows E maps, and the third row shows B maps.
Current usage metrics show cumulative count of Article Views (full-text article views including HTML views, PDF and ePub downloads, according to the available data) and Abstracts Views on Vision4Press platform.
Data correspond to usage on the plateform after 2015. The current usage metrics is available 48-96 hours after online publication and is updated daily on week days.
Initial download of the metrics may take a while.