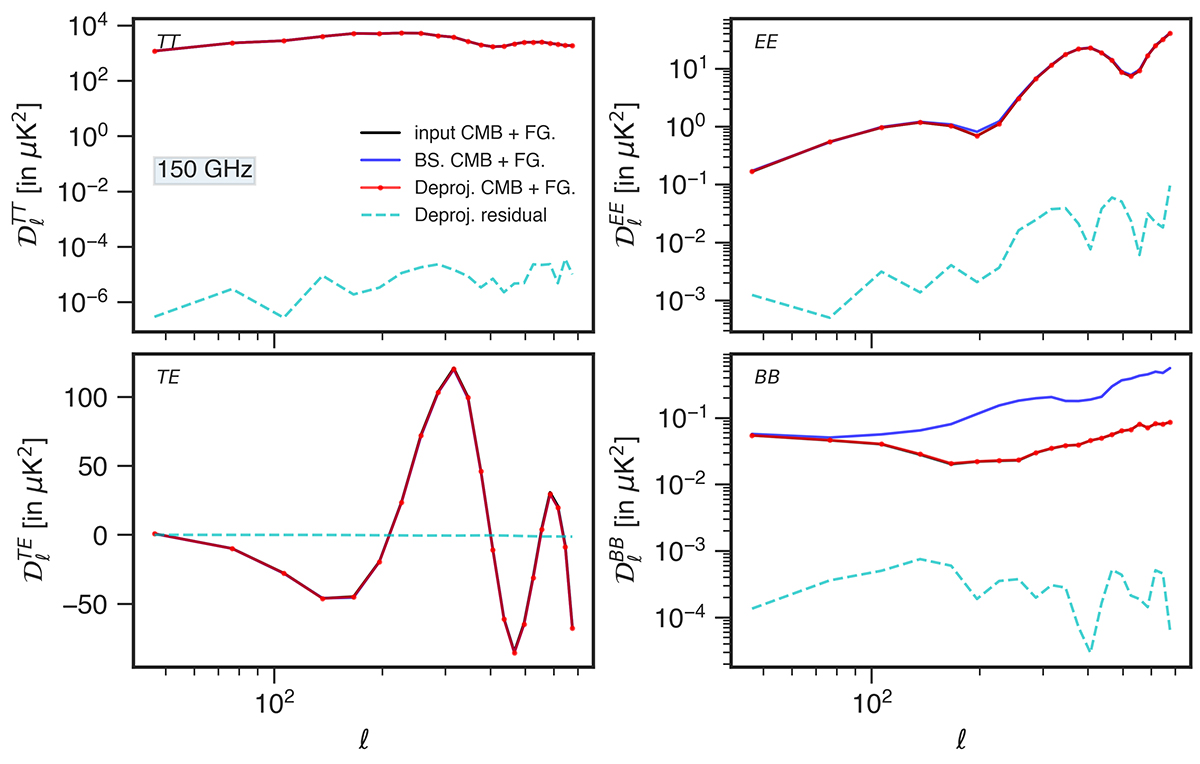
Fig. 3.
Download original image
TT, EE, TE, and BB power spectra of the 150 GHz CMB plus foregrounds map with beam systematics before (blue curves) and after deprojection (red curves) for one realization. The input CMB+FG. power spectrum without beam systematics is shown as a solid black curve for comparison with the deprojected one, and their difference, the residual after deprojection, is shown as a dashed cyan curve. The results of 95 GHz are similar to the 150 GHz results.
Current usage metrics show cumulative count of Article Views (full-text article views including HTML views, PDF and ePub downloads, according to the available data) and Abstracts Views on Vision4Press platform.
Data correspond to usage on the plateform after 2015. The current usage metrics is available 48-96 hours after online publication and is updated daily on week days.
Initial download of the metrics may take a while.