Fig. 2.
Download original image
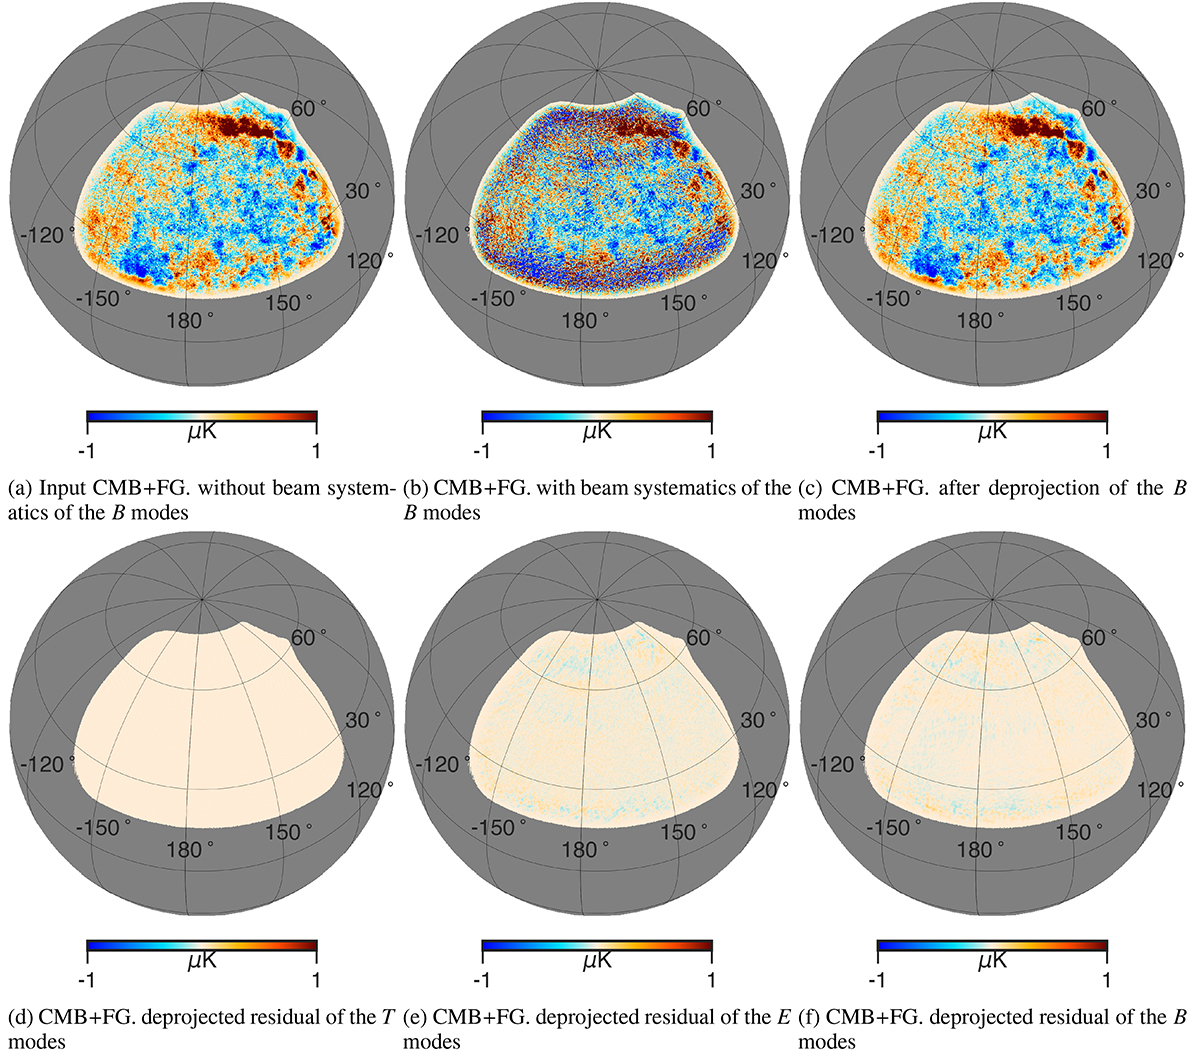
Maps of CMB plus foregrounds at S3 150 GHz. First row: Input B-mode CMB and foregrounds without beam systematics (left), CMB plus foregrounds with beam systematics (middle) and after deprojection (right). Second row: Difference between the deprojected map and the input map without beam systematics for the T (left), E (middle), and B (right) modes. The results of 95 GHz are similar to the 150 GHz results.
Current usage metrics show cumulative count of Article Views (full-text article views including HTML views, PDF and ePub downloads, according to the available data) and Abstracts Views on Vision4Press platform.
Data correspond to usage on the plateform after 2015. The current usage metrics is available 48-96 hours after online publication and is updated daily on week days.
Initial download of the metrics may take a while.