Fig. 1.
Download original image
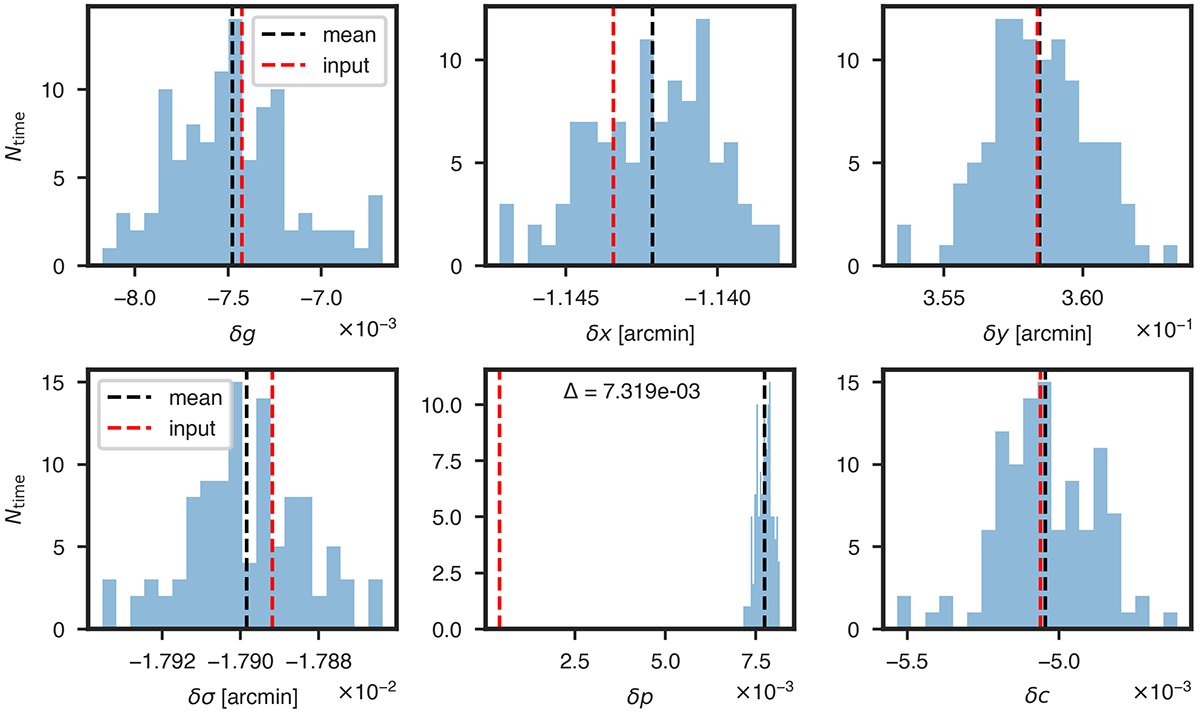
Distribution of the recovered beam mismatch parameters of 106 time trunks for one detector pair of a noise-free simulation at 150 GHz. The dashed red lines represent the input beam parameter, and the dashed black lines indicate the mean over all time series. There is a bias on the differential plus-ellipticity of Δ ≈ 7.3 × 10⁻³ due to the cosmological TE correlation.
Current usage metrics show cumulative count of Article Views (full-text article views including HTML views, PDF and ePub downloads, according to the available data) and Abstracts Views on Vision4Press platform.
Data correspond to usage on the plateform after 2015. The current usage metrics is available 48-96 hours after online publication and is updated daily on week days.
Initial download of the metrics may take a while.