Fig. 2.
Download original image
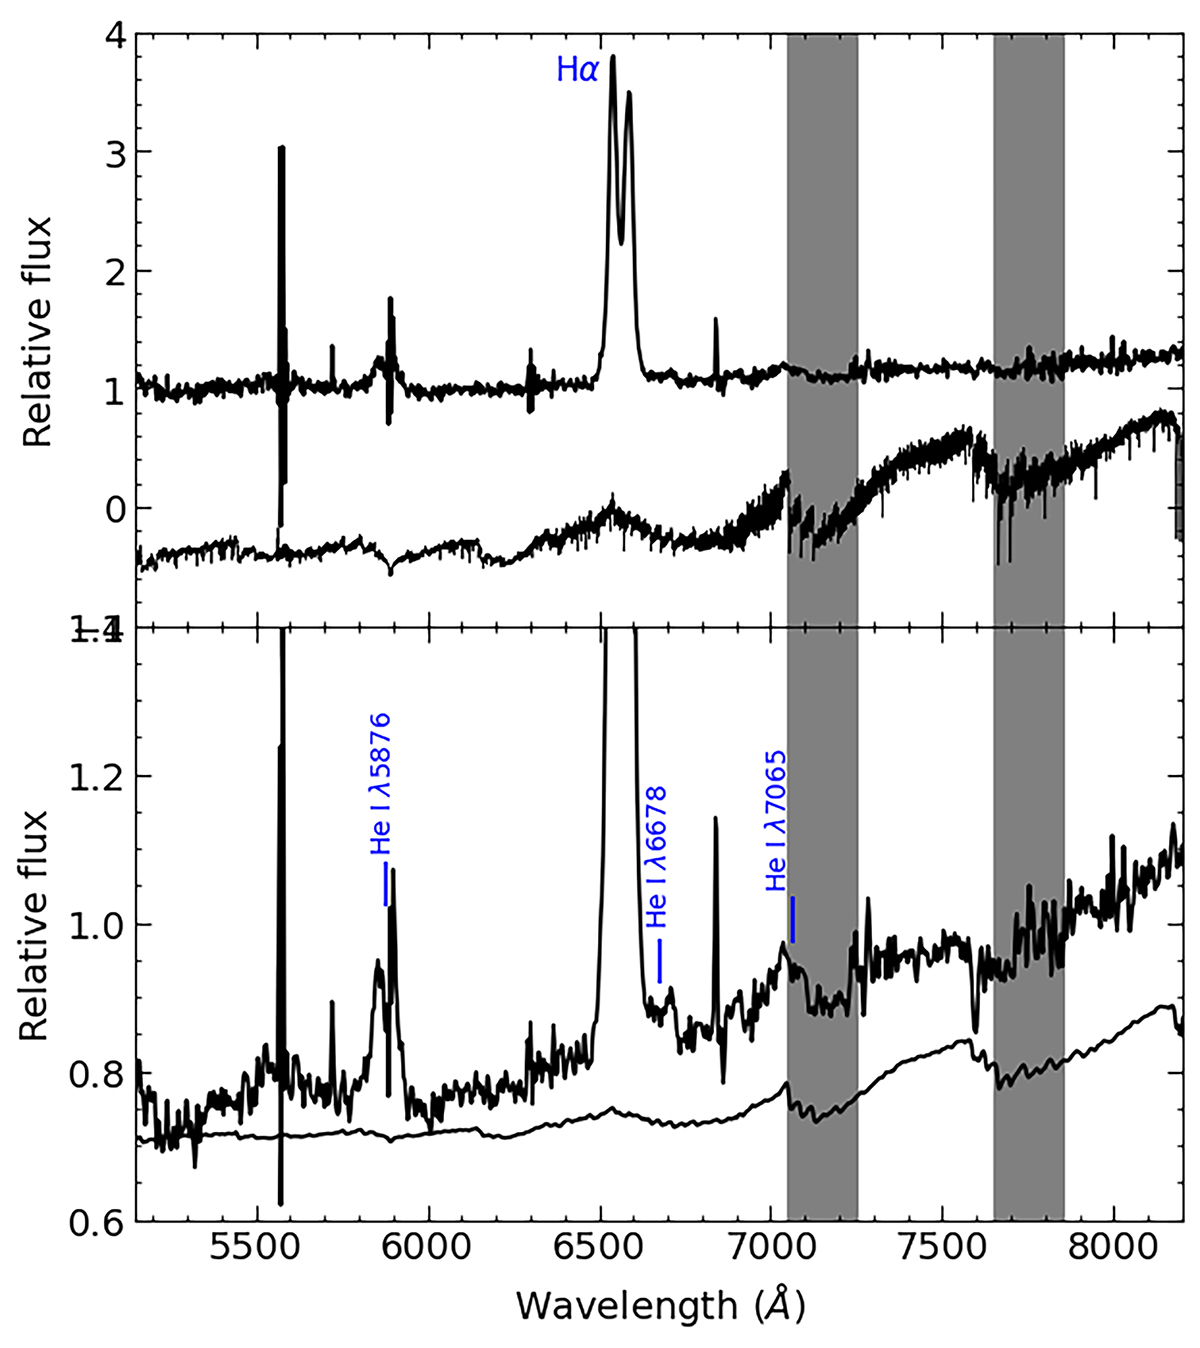
OSIRIS J1753 averaged spectrum. The upper panel displays the telluric-corrected and dereddened spectrum normalised to unity at 7500 Å. The location of the expected M-type companion star TiO molecular bands are marked with grey bands. The lower panel presents a close up view of the same spectrum after smoothing using a Gaussian with FWHM = 2 pixels. The He I 5876 Å, 6678 Å, and 7065 Å emission lines are highlighted in blue. An M4 V template star (HD 125455B) broadened to match the target spectral resolution is overplotted. The latter has been scaled by a factor of 0.08 to simulate the companion flux contribution in the i-band and shifted in the y-axis for display purposes.
Current usage metrics show cumulative count of Article Views (full-text article views including HTML views, PDF and ePub downloads, according to the available data) and Abstracts Views on Vision4Press platform.
Data correspond to usage on the plateform after 2015. The current usage metrics is available 48-96 hours after online publication and is updated daily on week days.
Initial download of the metrics may take a while.