Fig. 4.
Download original image
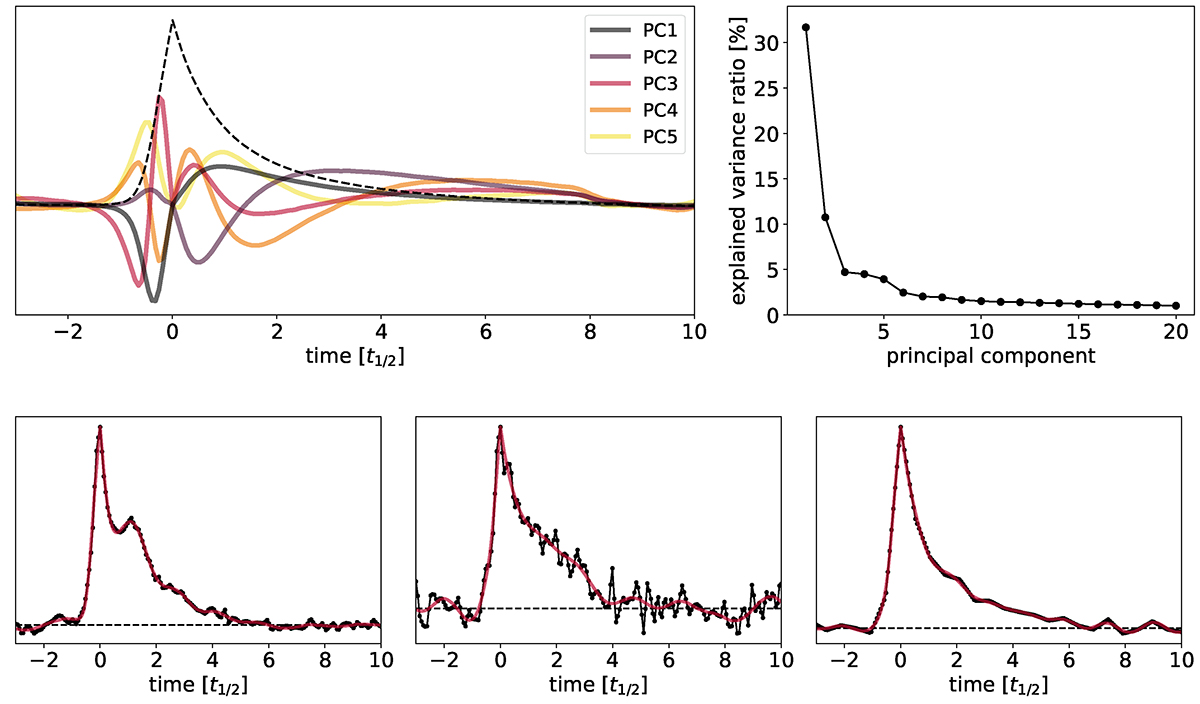
Weighted PCA basis. Upper left: First five PCs, with a dashed line denoting the average flare profile. Upper right: Ratio of the sample variance that a given PC can recover. A single feature from the original 200-dimensional dataset would amount to 0.5%. Lower panels: Example light curves with the PCA reconstruction using 20 PCs.
Current usage metrics show cumulative count of Article Views (full-text article views including HTML views, PDF and ePub downloads, according to the available data) and Abstracts Views on Vision4Press platform.
Data correspond to usage on the plateform after 2015. The current usage metrics is available 48-96 hours after online publication and is updated daily on week days.
Initial download of the metrics may take a while.