Open Access
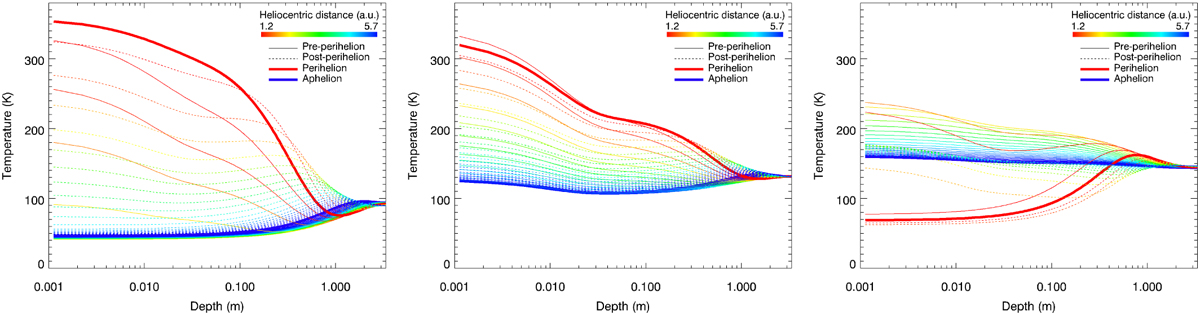
Fig. 9
Download original image
Temperature as a function of time and depth for different plains (low slope terrains) located in the SH (left), at the equator (middle), and in the NH (right). The colour indicates time (heliocentric distance), with solid lines representing pre-perihelion and dashed lines representing post-perihelion.
Current usage metrics show cumulative count of Article Views (full-text article views including HTML views, PDF and ePub downloads, according to the available data) and Abstracts Views on Vision4Press platform.
Data correspond to usage on the plateform after 2015. The current usage metrics is available 48-96 hours after online publication and is updated daily on week days.
Initial download of the metrics may take a while.