Fig. 14
Download original image
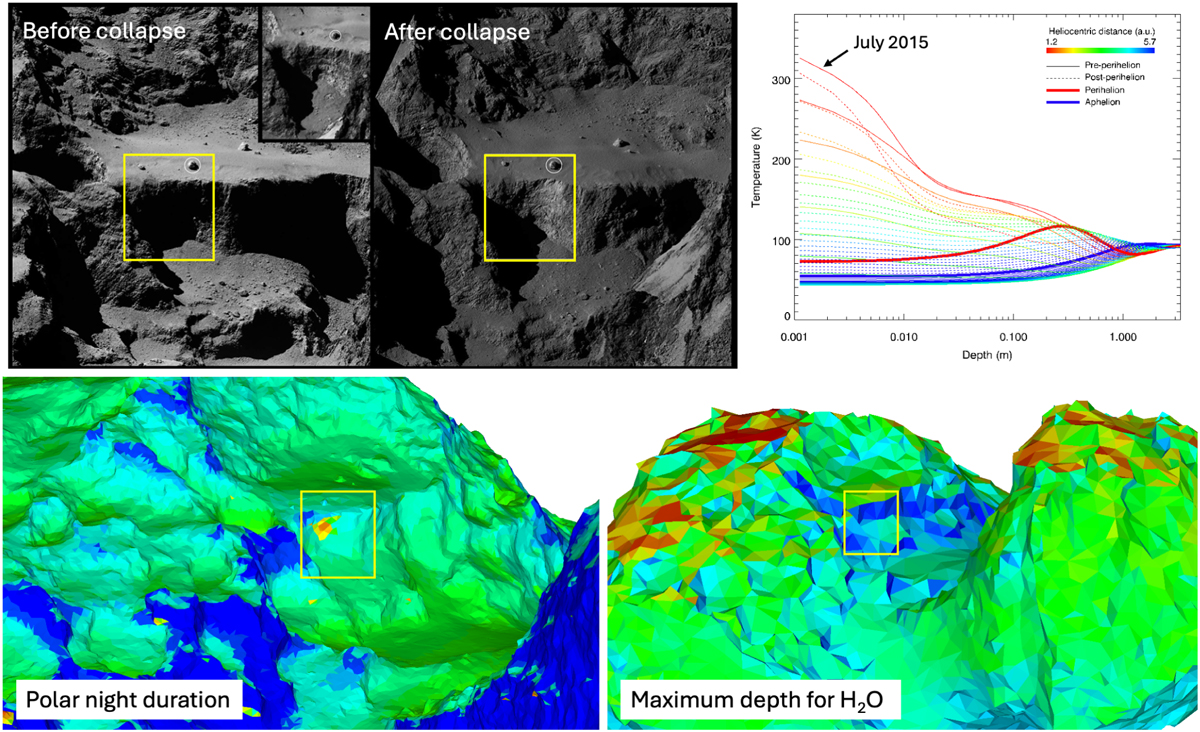
Thermal environment of the cliff collapse observed in the Aswan region. Upper-left panel: two OSIRIS/NAC images of the Aswan cliff before and after the collapse, adapted from Pajola et al. (2017). Upper-right panel: temperature as a function of time and depth at the site of the cliff collapse, similar to Fig. 9. Lower-left panel: duration of polar night, extracted from Fig. A.1. Lower-right panel: maximum depth for water, extracted from Fig. 11. In all panels, the yellow box indicates the location of the cliff collapse.
Current usage metrics show cumulative count of Article Views (full-text article views including HTML views, PDF and ePub downloads, according to the available data) and Abstracts Views on Vision4Press platform.
Data correspond to usage on the plateform after 2015. The current usage metrics is available 48-96 hours after online publication and is updated daily on week days.
Initial download of the metrics may take a while.