Fig. 7.
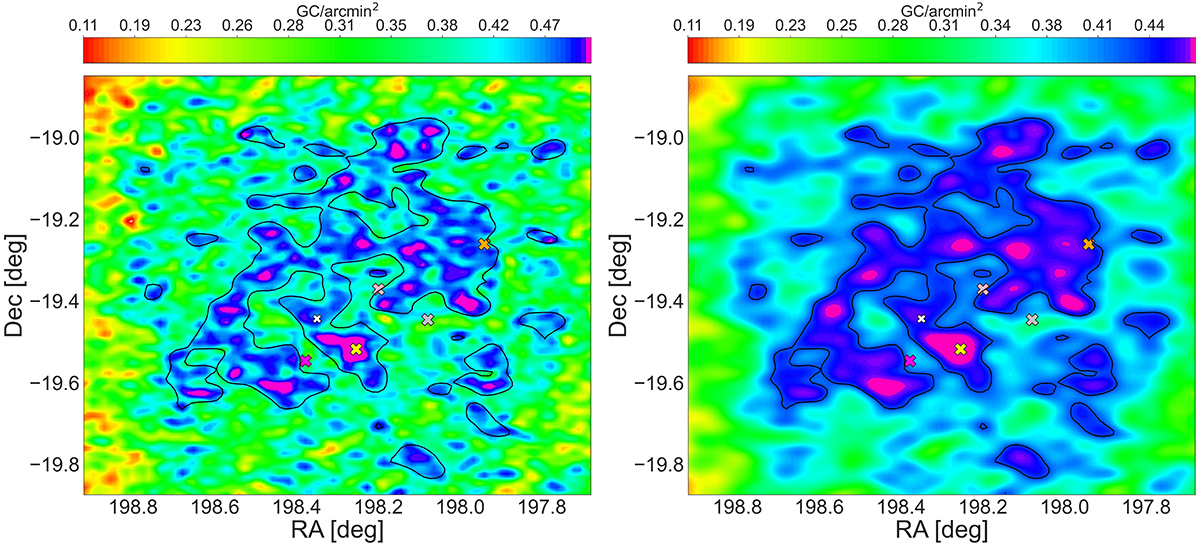
Download original image
2D distribution map of GC candidates in the observed field. Left panel: 2D map for the gr-matched catalogue obtained using bw_adjust = 0.14 and bw_method parameter set to Scott (see Sect. 6.1 for the definitions). The magenta and blue coloured areas represent an over-density of sources whereas the red and yellow-green coloured areas show the under-dense regions. The red coloured areas, mostly situated around the edges of the frame, are under-dense due to the low S/N because of the observing strategy. The position of the galaxies are indicated with crosses of colour yellow (NGC 5018), magenta (NGC 5022), cyan (MCG-03-34-013), orange (NGC 5006), light pink (PGC 140148). The white cross is the LSB dwarf galaxy candidate (NGC 5018-LSB1) reported in Sect. 6.3. Right panel: As in left panel, but using bw_adjust = 0.28. The black contours reported in both the panels indicate the regions higher than 5σ level from the background rms, obtained using bw_adjust = 0.28.
Current usage metrics show cumulative count of Article Views (full-text article views including HTML views, PDF and ePub downloads, according to the available data) and Abstracts Views on Vision4Press platform.
Data correspond to usage on the plateform after 2015. The current usage metrics is available 48-96 hours after online publication and is updated daily on week days.
Initial download of the metrics may take a while.