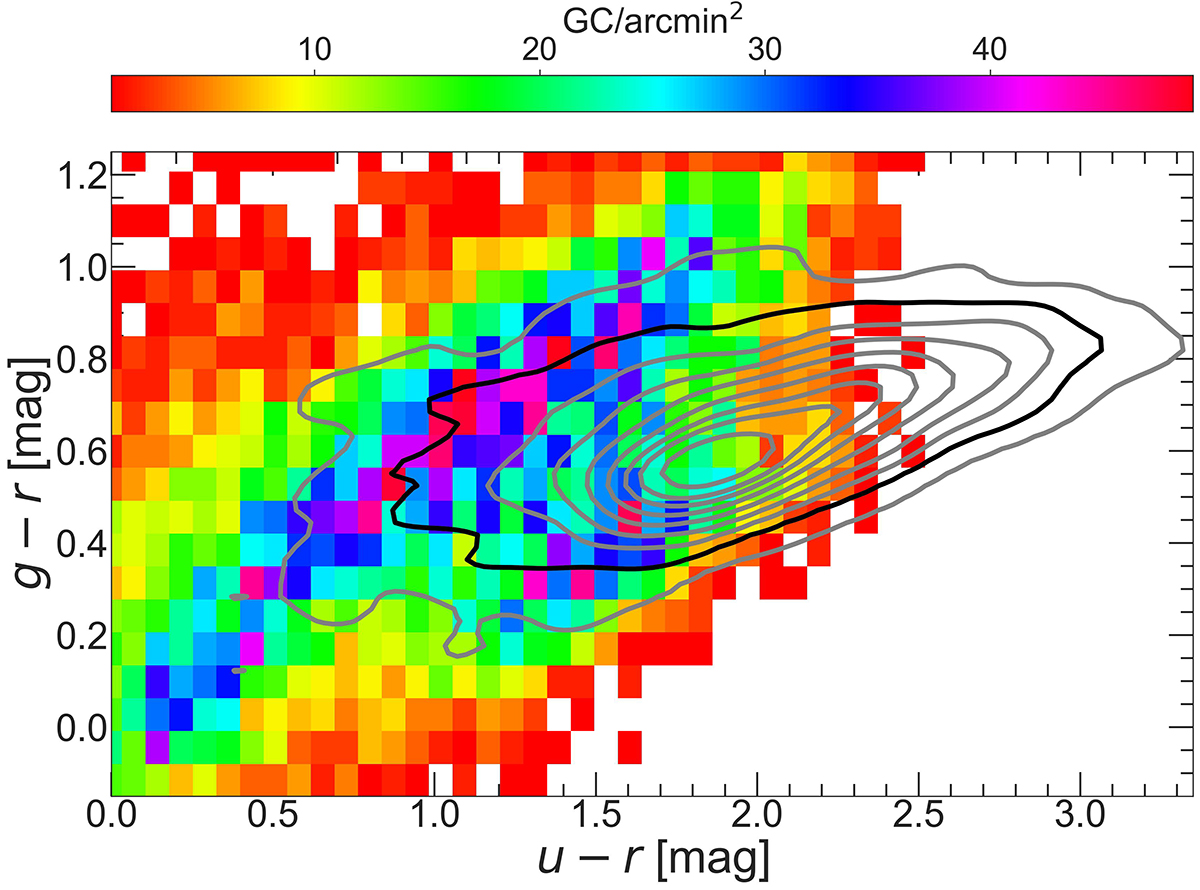
Fig. 5.
Download original image
2D histogram of pre-selected GC candidates (based on morphometric and magnitude parameters only) in the (u − r) vs (g − r) plane, showing sources from the ugr-matched catalogue. The over-dense regions (red and pink) represent sequences of contaminants, mostly foreground stars and background galaxies. The isodensity contours, computed using spectroscopically confirmed GCs in the Fornax cluster from FDS data (Cantiello et al. 2020), are over-plotted. The contours range from 10% (innermost) to 90% (outermost) in steps of 10%. Only the sources within the 80% contour (highlighted with a thick black contour) are selected as GC candidates from the ugr-matched catalogue.
Current usage metrics show cumulative count of Article Views (full-text article views including HTML views, PDF and ePub downloads, according to the available data) and Abstracts Views on Vision4Press platform.
Data correspond to usage on the plateform after 2015. The current usage metrics is available 48-96 hours after online publication and is updated daily on week days.
Initial download of the metrics may take a while.