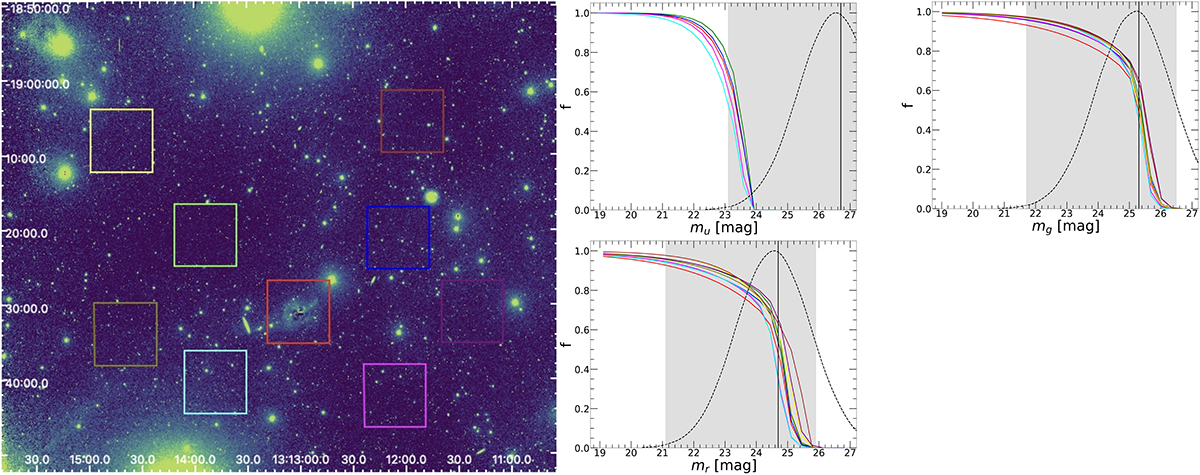
Fig. 4.
Download original image
Estimated completeness over the field. Left panel: r-passband image highlighting the regions selected for completeness analysis in the observed field. The area of the entire frame inspected for GCs is 1.25 × 1.03 sq. degrees; north is up, and east is left. The region highlighted in red is centred on NGC 5018. The eight off-galaxy regions surrounding the galaxy are highlighted with green, blue, magenta, cyan, olive, yellow, brown, and purple boxes. Each region is 8.4′ × 8.4′ in size. Middle and right panels: Completeness functions simulated and fitted using the modified Fermi function (Eq. 4) for the u- (middle top), g- (right), and r- passbands (middle bottom). The solid curves are colour-coded according to the boxed regions in the left panel. The vertical solid black line marks the expected TOM of the GCLF in the respective passbands. The grey-shaded region indicates the adopted magnitude range for GC selection in the three passbands (see Sect. 5.1). The dashed black curves represent the expected GCLF in the respective passbands (see Sect. 4.3 for details).
Current usage metrics show cumulative count of Article Views (full-text article views including HTML views, PDF and ePub downloads, according to the available data) and Abstracts Views on Vision4Press platform.
Data correspond to usage on the plateform after 2015. The current usage metrics is available 48-96 hours after online publication and is updated daily on week days.
Initial download of the metrics may take a while.