Fig. 3.
Download original image
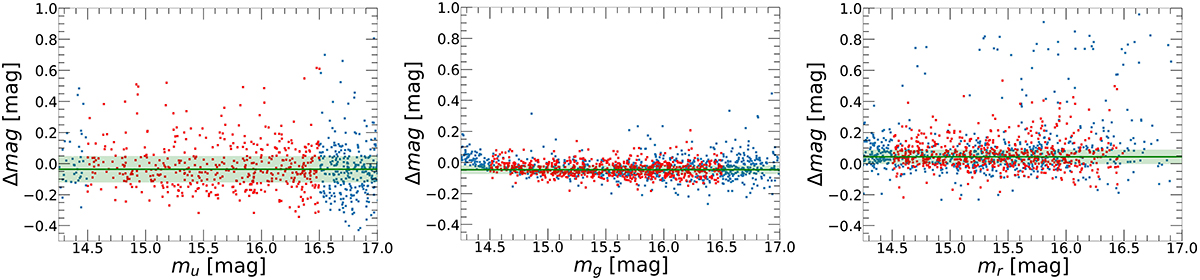
Comparison between VST and APASS magnitudes (Δ mag = mVST − mAPASS) in u- (left), g- (middle), and r- (right) passbands. Blue dots represent all the sources in ugr-matched catalogue which is matched with APASS catalogue. Red dots represent the bright, unsaturated and point-like sources that we select for photometric comparison. Median and RMSMAD values of Δ mag in the three passbands are shown by green horizontal line and shaded regions, respectively and the values are reported in Table 2.
Current usage metrics show cumulative count of Article Views (full-text article views including HTML views, PDF and ePub downloads, according to the available data) and Abstracts Views on Vision4Press platform.
Data correspond to usage on the plateform after 2015. The current usage metrics is available 48-96 hours after online publication and is updated daily on week days.
Initial download of the metrics may take a while.