Fig. 18.
Download original image
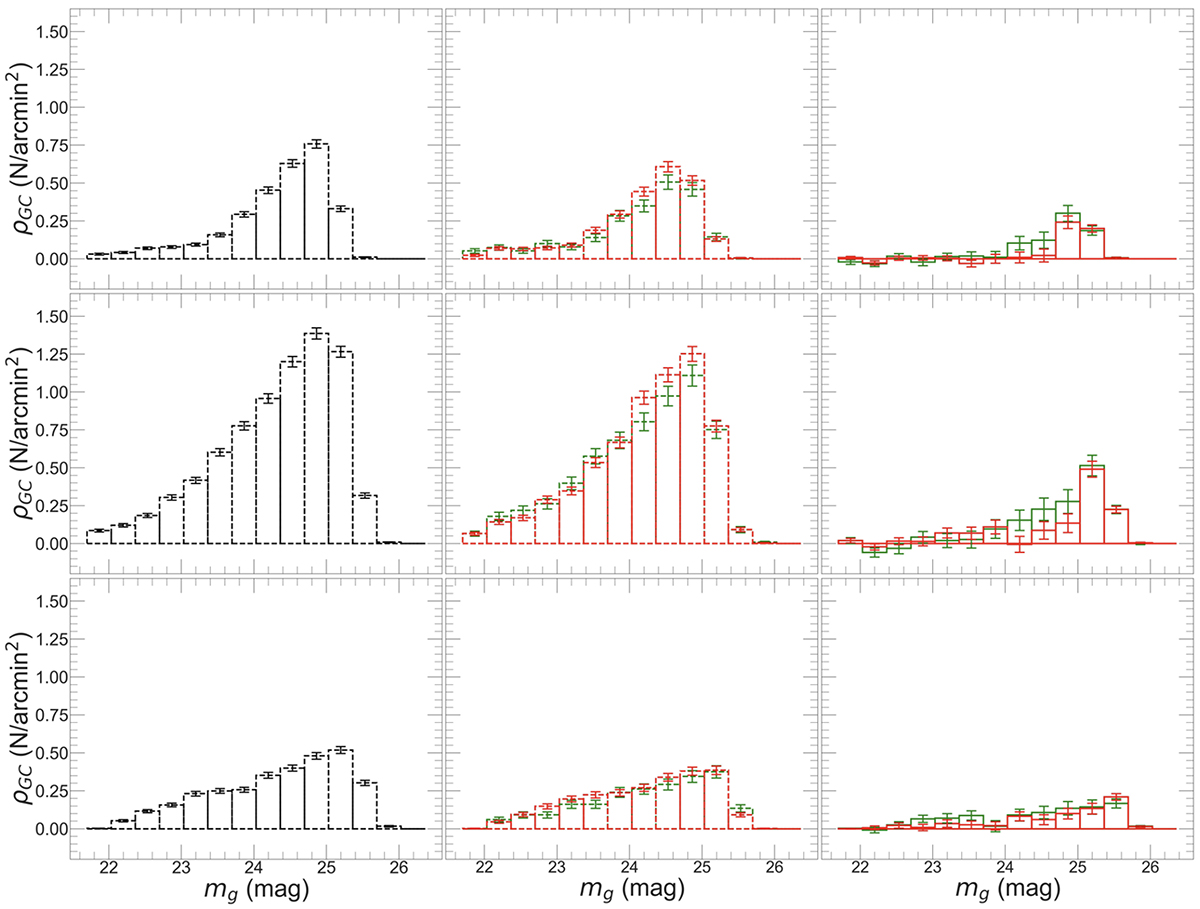
Luminosity function of GC candidates. Top row: For blue GC candidates (0.30 < g − r ≤ 0.45 mag) from the gr-matched catalogue in the elliptical over-density region (black dashed histogram in the left panel), annular and random backgrounds (red and green dashed histograms, respectively, in the middle panel) and residuals obtained after background subtractions (red and green solid histograms in the right panel). Middle and Bottom rows: Same as top row, but for intermediate GC candidates (0.45 < g − r ≤ 0.85 mag) and red GC candidates (0.85 < g − r ≤ 1.10 mag), respectively (see Sect. 6.4).
Current usage metrics show cumulative count of Article Views (full-text article views including HTML views, PDF and ePub downloads, according to the available data) and Abstracts Views on Vision4Press platform.
Data correspond to usage on the plateform after 2015. The current usage metrics is available 48-96 hours after online publication and is updated daily on week days.
Initial download of the metrics may take a while.