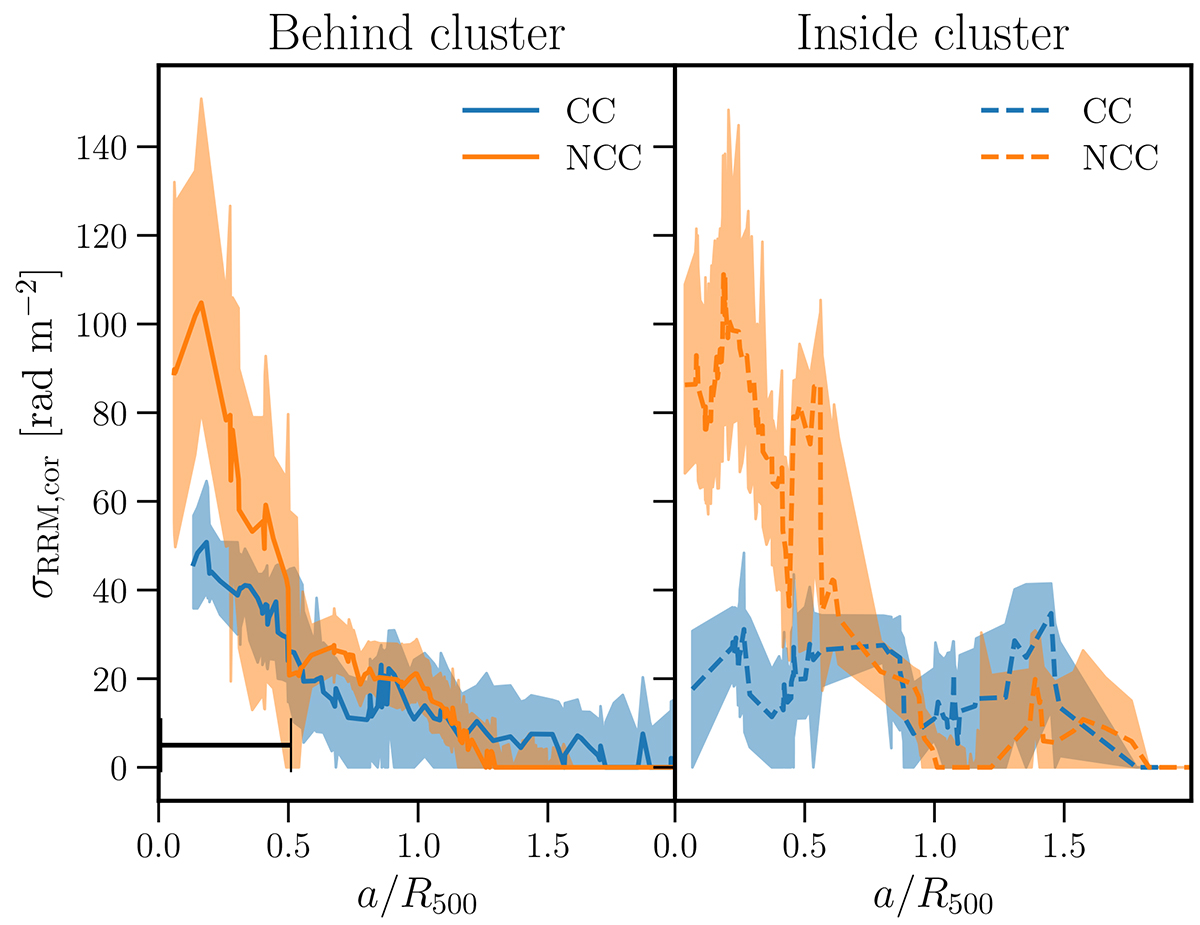
Fig. 8.
Download original image
Corrected scatter of RRMs as a function of the projected distance to the nearest cluster centre. Cool-core clusters are shown in blue, while non-cool-core clusters are shown in orange. The left panel shows background sources, while the right panel shows cluster members. The running scatter is calculated using a fixed sliding window of size 0.50, indicated by the horizontal errorbar.
Current usage metrics show cumulative count of Article Views (full-text article views including HTML views, PDF and ePub downloads, according to the available data) and Abstracts Views on Vision4Press platform.
Data correspond to usage on the plateform after 2015. The current usage metrics is available 48-96 hours after online publication and is updated daily on week days.
Initial download of the metrics may take a while.