Open Access
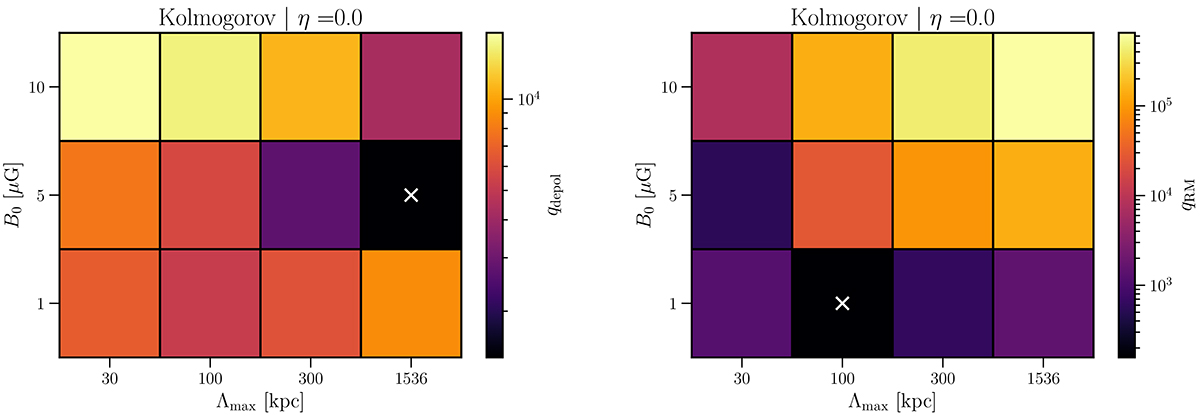
Fig. B.6.
Download original image
Values of qdepol (left) and qRM (right) as defined in Equation 14 for combinations of B0 and ΛRM. Models are simulated with a Kolmogorov power spectrum and η = 0.0. The best-fit model is marked by a cross.
Current usage metrics show cumulative count of Article Views (full-text article views including HTML views, PDF and ePub downloads, according to the available data) and Abstracts Views on Vision4Press platform.
Data correspond to usage on the plateform after 2015. The current usage metrics is available 48-96 hours after online publication and is updated daily on week days.
Initial download of the metrics may take a while.