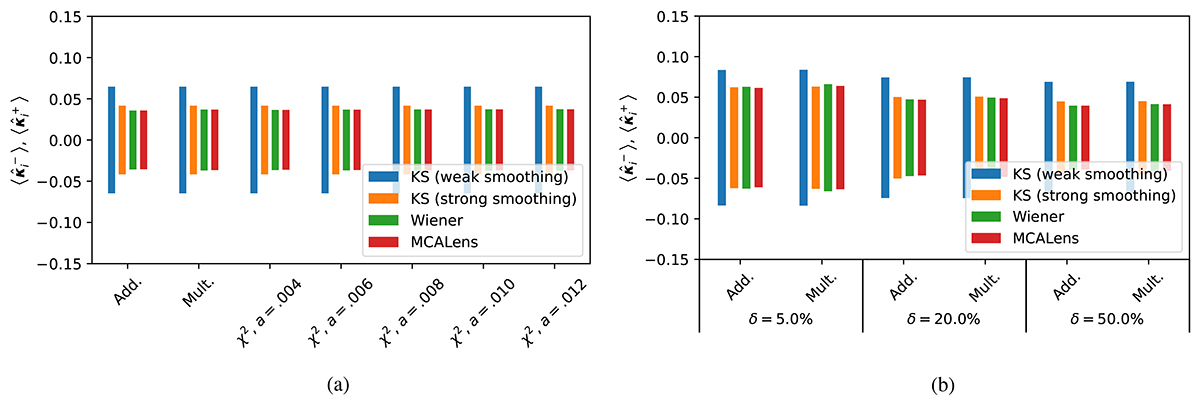
Fig. 6.
Download original image
Mean values for the lower and upper confidence bounds computed over the span of each image. The bar sizes represent the mean length of the error bars. As in Fig. 5, the values were computed over the test set (γi, κi)i = n + 1m for various families of calibration functions (gλ)λ. After calibration with CQR, the choice of mass mapping method does not influence the average miscoverage rate (Fig. 5a), but it does significantly affect the size of the error bars (Fig. 6a). Additionally, RCPS, which tends to produce overconservative prediction bounds (Fig. 5b), yields larger error bars than CQR (Fig. 6b vs 6a). (a) CQR, (b) RCPS.
Current usage metrics show cumulative count of Article Views (full-text article views including HTML views, PDF and ePub downloads, according to the available data) and Abstracts Views on Vision4Press platform.
Data correspond to usage on the plateform after 2015. The current usage metrics is available 48-96 hours after online publication and is updated daily on week days.
Initial download of the metrics may take a while.