Fig. 8.
Download original image
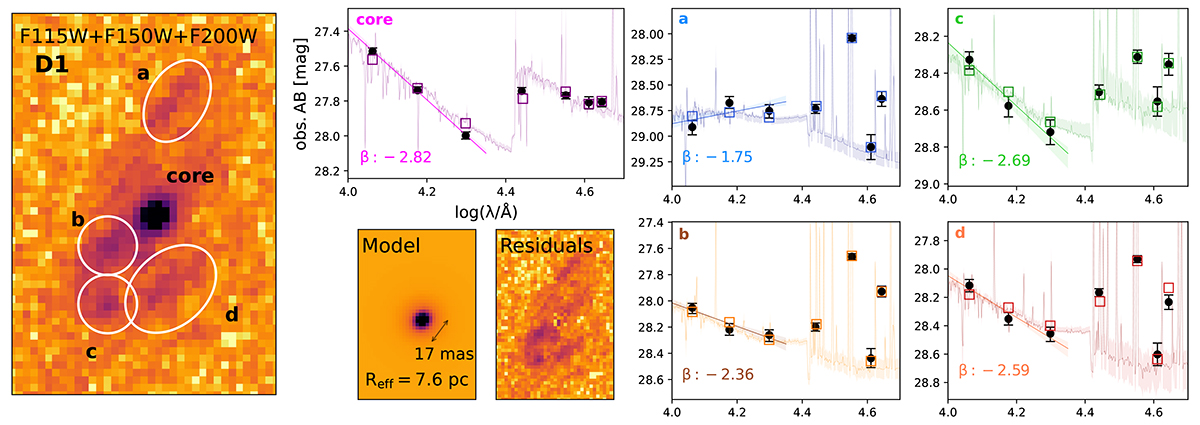
Zoom-in into the D1 region, showing the combined SW observations (F115W+F150W+F200W), the best-fit model of the core region, and its residuals. The apertures used for photometry are shown as white ellipses; for the D1core region, photometry is derived from a light-profile fitting (as described in the main text). For each of the apertures/regions, photometry is shown as black circles, with the SED best-fit model over-plotted as colored empty squares and relative spectrum. The best-fit of the UV slope is also shown and reported in the panels.
Current usage metrics show cumulative count of Article Views (full-text article views including HTML views, PDF and ePub downloads, according to the available data) and Abstracts Views on Vision4Press platform.
Data correspond to usage on the plateform after 2015. The current usage metrics is available 48-96 hours after online publication and is updated daily on week days.
Initial download of the metrics may take a while.