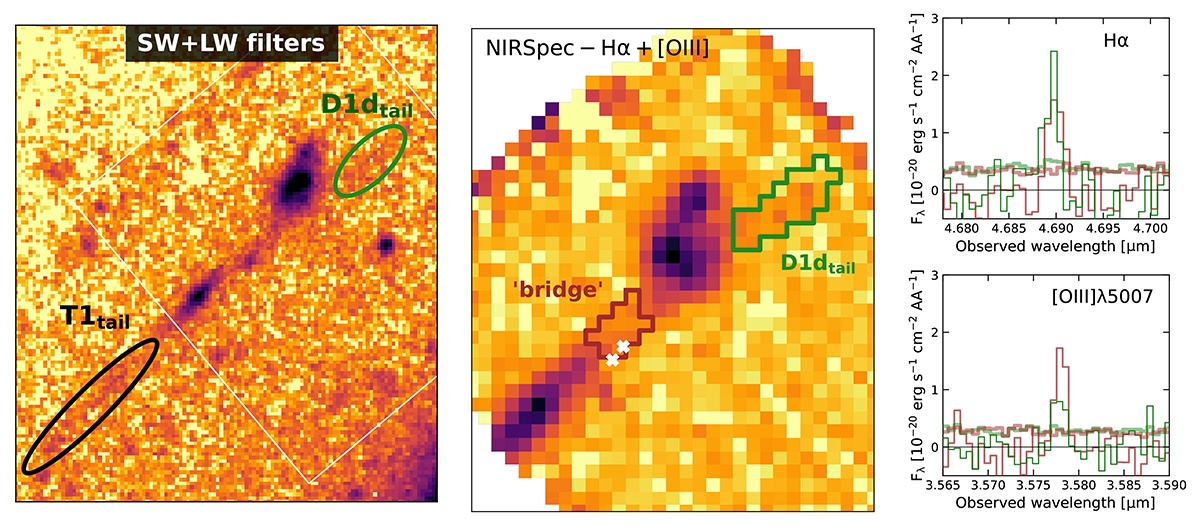
Fig. 6.
Download original image
Imaging and spectroscopy of the faint regions. Left panel: NIRCam sum of all filters (both from the SW and from the LW channels). The apertures used to derive the magnitudes (or upper limits) of the faint regions are shown as elliptical contours. The FoV of the IFU is shown as a white contour. Central panel: IFU observations showing the sum of Hα and [OIII] emission lines with the masks used to extract the spectra shown in the right panel. Two white “X” symbols mark the position of the UT1a and UT1b peaks. Right panel: Spectra from the two masks of the central panel, using their same color-coding. As done in Fig. 2, thick shaded lines are used to show the uncertainties of each spectrum.
Current usage metrics show cumulative count of Article Views (full-text article views including HTML views, PDF and ePub downloads, according to the available data) and Abstracts Views on Vision4Press platform.
Data correspond to usage on the plateform after 2015. The current usage metrics is available 48-96 hours after online publication and is updated daily on week days.
Initial download of the metrics may take a while.