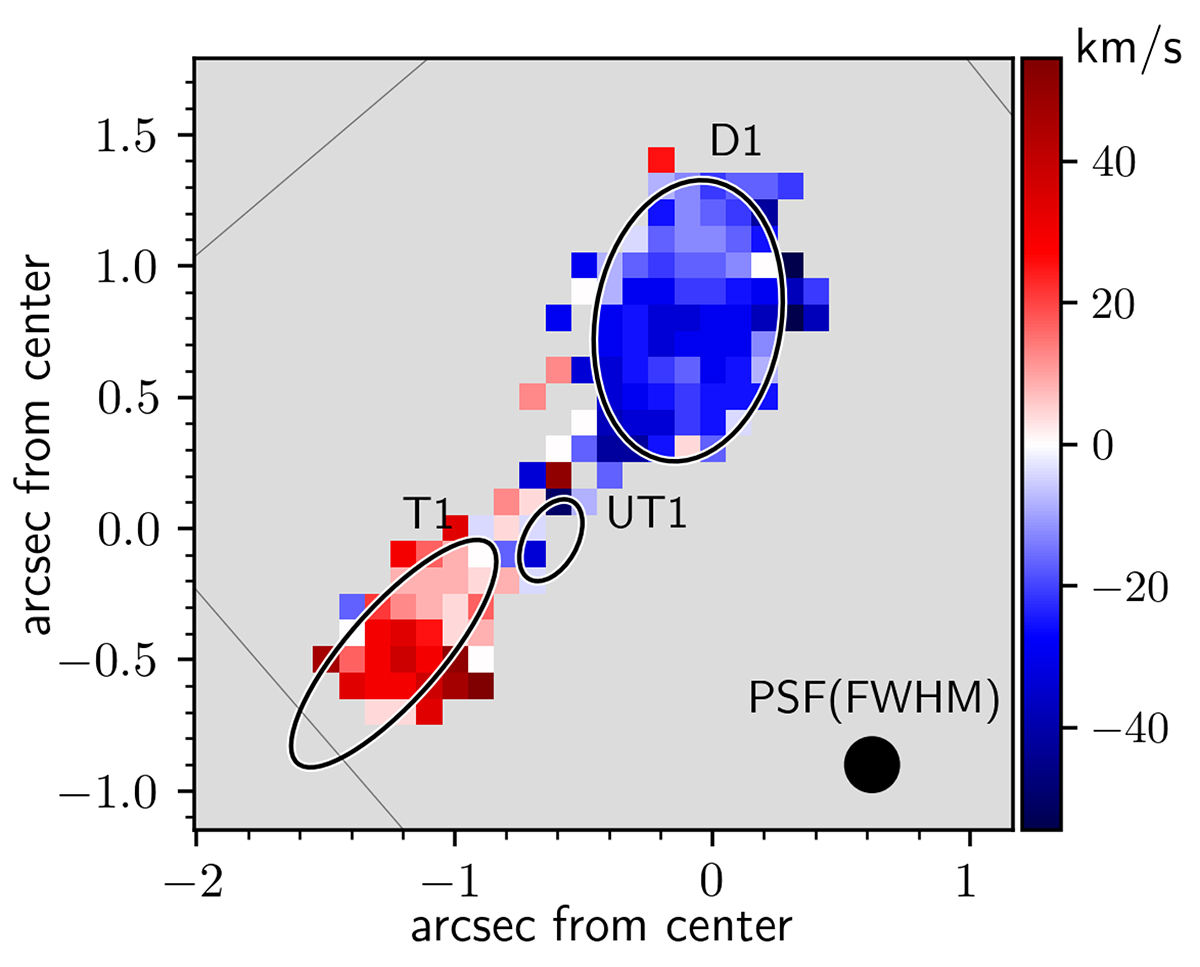
Fig. 5.
Download original image
Velocity map of the system with ellipses marking the positions of the main regions (these are the same apertures as those used for the photometric analysis in Sect. 3.2 and shown over the NIRCam data in Fig. 2). The uncertainties on the velocity measurements (based on bootstrapping from the variance map of the IFU cube) are on average ∼1 km s−1, and ≤4 km s−1 in all pixels. The map is created combining the signal of all the four main lines observed (Angora et al., in prep., for details). The FWHM of the IFU PSF is given in the bottom-right corner.
Current usage metrics show cumulative count of Article Views (full-text article views including HTML views, PDF and ePub downloads, according to the available data) and Abstracts Views on Vision4Press platform.
Data correspond to usage on the plateform after 2015. The current usage metrics is available 48-96 hours after online publication and is updated daily on week days.
Initial download of the metrics may take a while.