Fig. F.1.
Download original image
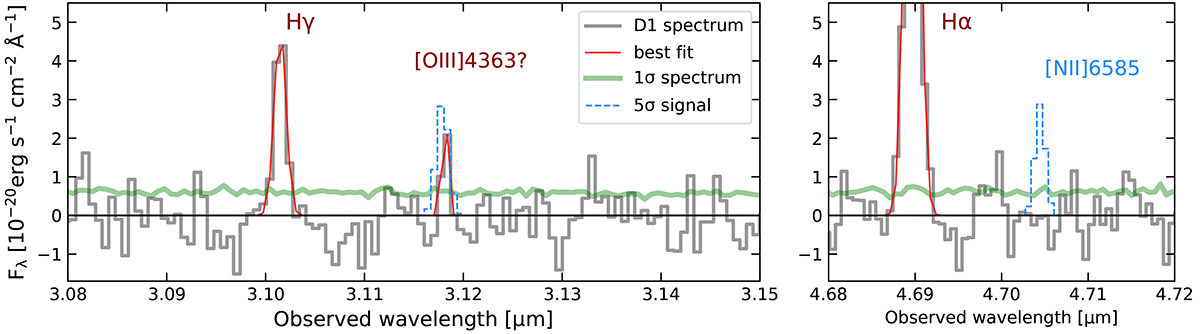
Spectra of the D1 region covering the wavelengths nearby the Hγ(left panel) and the Hα(right panel) lines, including the best-fits of the observed lines. The left panel also includes a tentative detection of the [OIII]λ4363 line. An artificial 5σ signal at the expected wavelength of the [O III]λ4363 and of the [NII]λ6585 lines is shown as a blue-dashed line.
Current usage metrics show cumulative count of Article Views (full-text article views including HTML views, PDF and ePub downloads, according to the available data) and Abstracts Views on Vision4Press platform.
Data correspond to usage on the plateform after 2015. The current usage metrics is available 48-96 hours after online publication and is updated daily on week days.
Initial download of the metrics may take a while.