Fig. 5.
Download original image
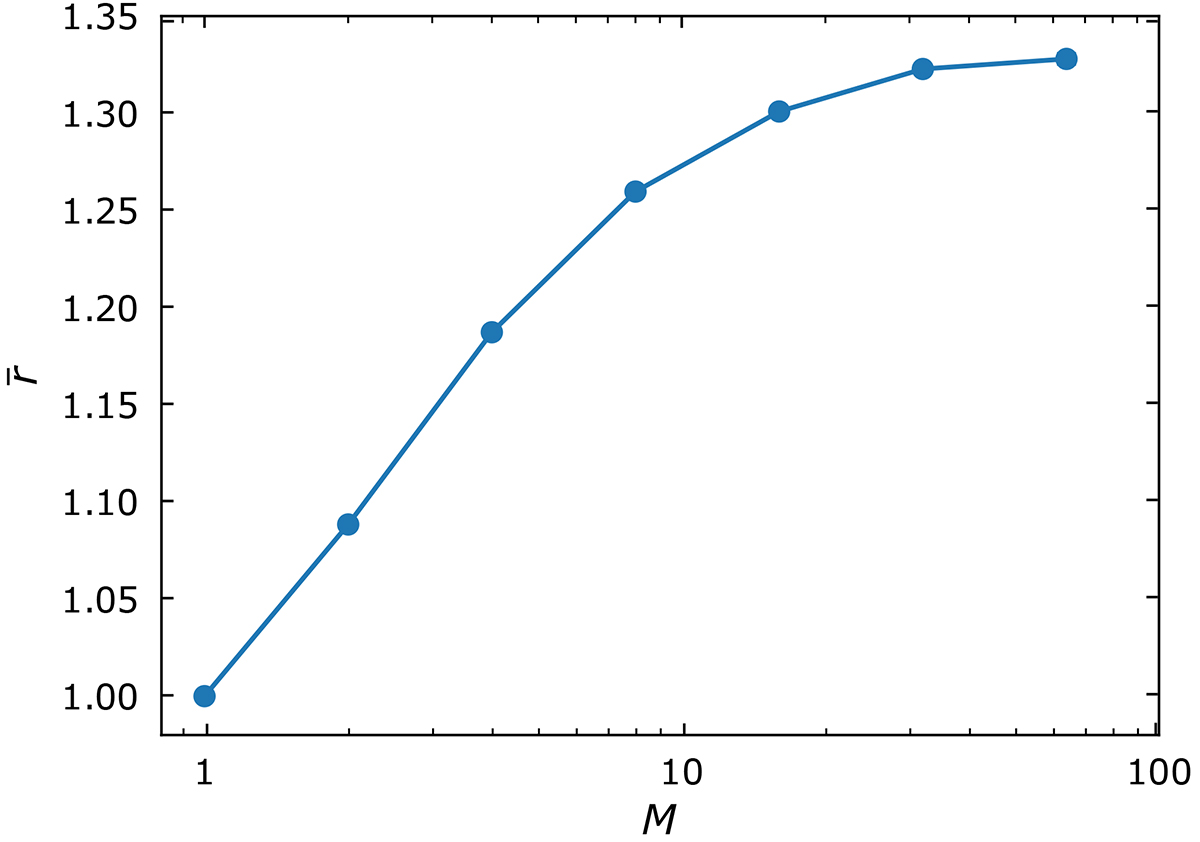
Estimate of the effective influence of the noise correlations for the E noise images for test Ic and S/N ≃ 30. The ![]() factor is plotted as a function of the side length M of the sub-regions of 2000 noise images and the error bars are the standard error of the mean. In this case, the value of
factor is plotted as a function of the side length M of the sub-regions of 2000 noise images and the error bars are the standard error of the mean. In this case, the value of ![]() for large values of M gives the factor by which the S/N is overestimated when ignoring the noise correlations.
for large values of M gives the factor by which the S/N is overestimated when ignoring the noise correlations.
Current usage metrics show cumulative count of Article Views (full-text article views including HTML views, PDF and ePub downloads, according to the available data) and Abstracts Views on Vision4Press platform.
Data correspond to usage on the plateform after 2015. The current usage metrics is available 48-96 hours after online publication and is updated daily on week days.
Initial download of the metrics may take a while.