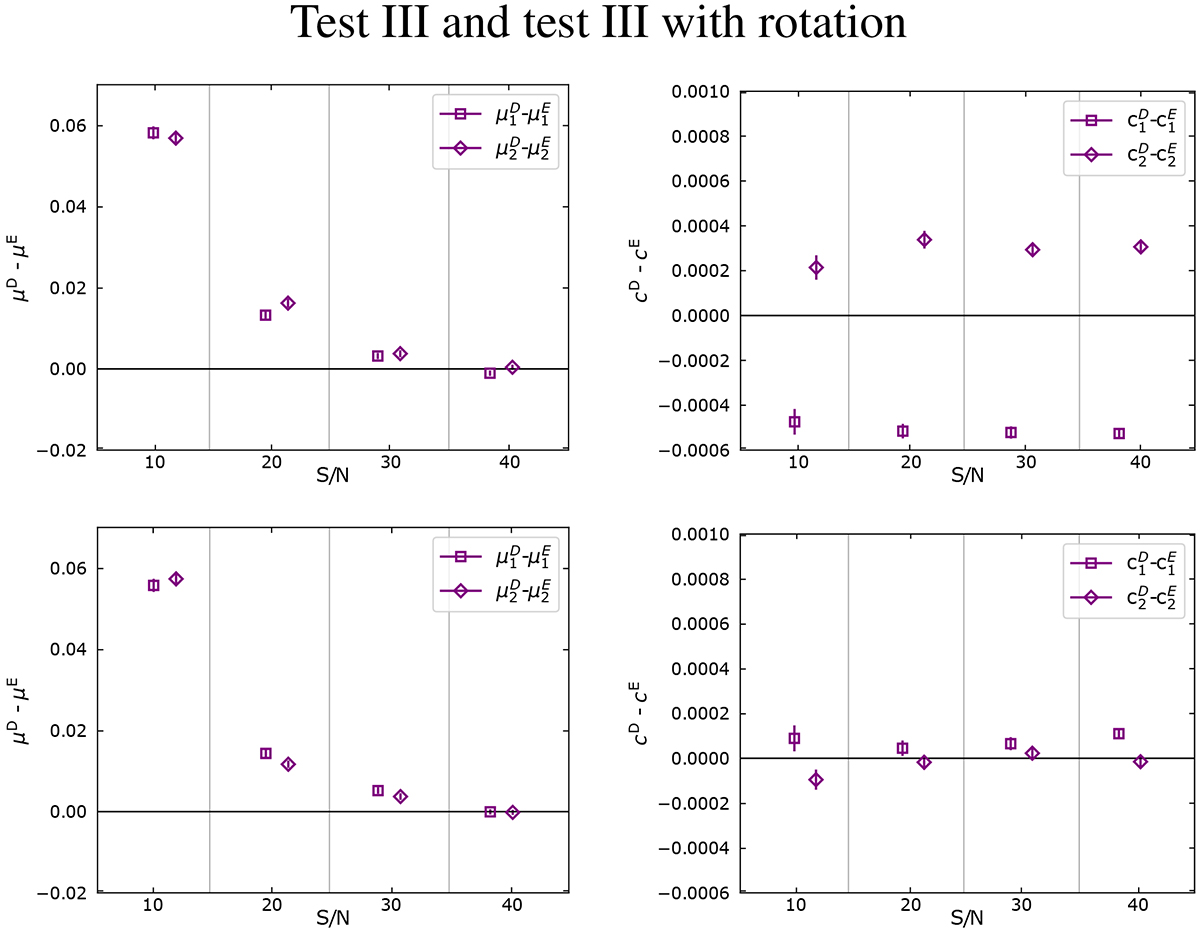
Fig. 13.
Download original image
Effect of HST PSF error and post-deconvolution isotropisation. Multiplicative (left panel) and additive (right panel) shear bias differences obtained when using two different HST TinyTim PSF models for HST conv and HST deconv and a pixel scale of ![]() (upper panels, test III), as described in Sect. 5.5. The lower panels show the results applying an extra rotation after the deconvolution (test III with rotat.). The data points show the bias obtained from the fit with the error bars indicating 1σ uncertainties for a number of galaxies Ngal ≃ 24.7 × 10⁶ for each S/N value.
(upper panels, test III), as described in Sect. 5.5. The lower panels show the results applying an extra rotation after the deconvolution (test III with rotat.). The data points show the bias obtained from the fit with the error bars indicating 1σ uncertainties for a number of galaxies Ngal ≃ 24.7 × 10⁶ for each S/N value.
Current usage metrics show cumulative count of Article Views (full-text article views including HTML views, PDF and ePub downloads, according to the available data) and Abstracts Views on Vision4Press platform.
Data correspond to usage on the plateform after 2015. The current usage metrics is available 48-96 hours after online publication and is updated daily on week days.
Initial download of the metrics may take a while.