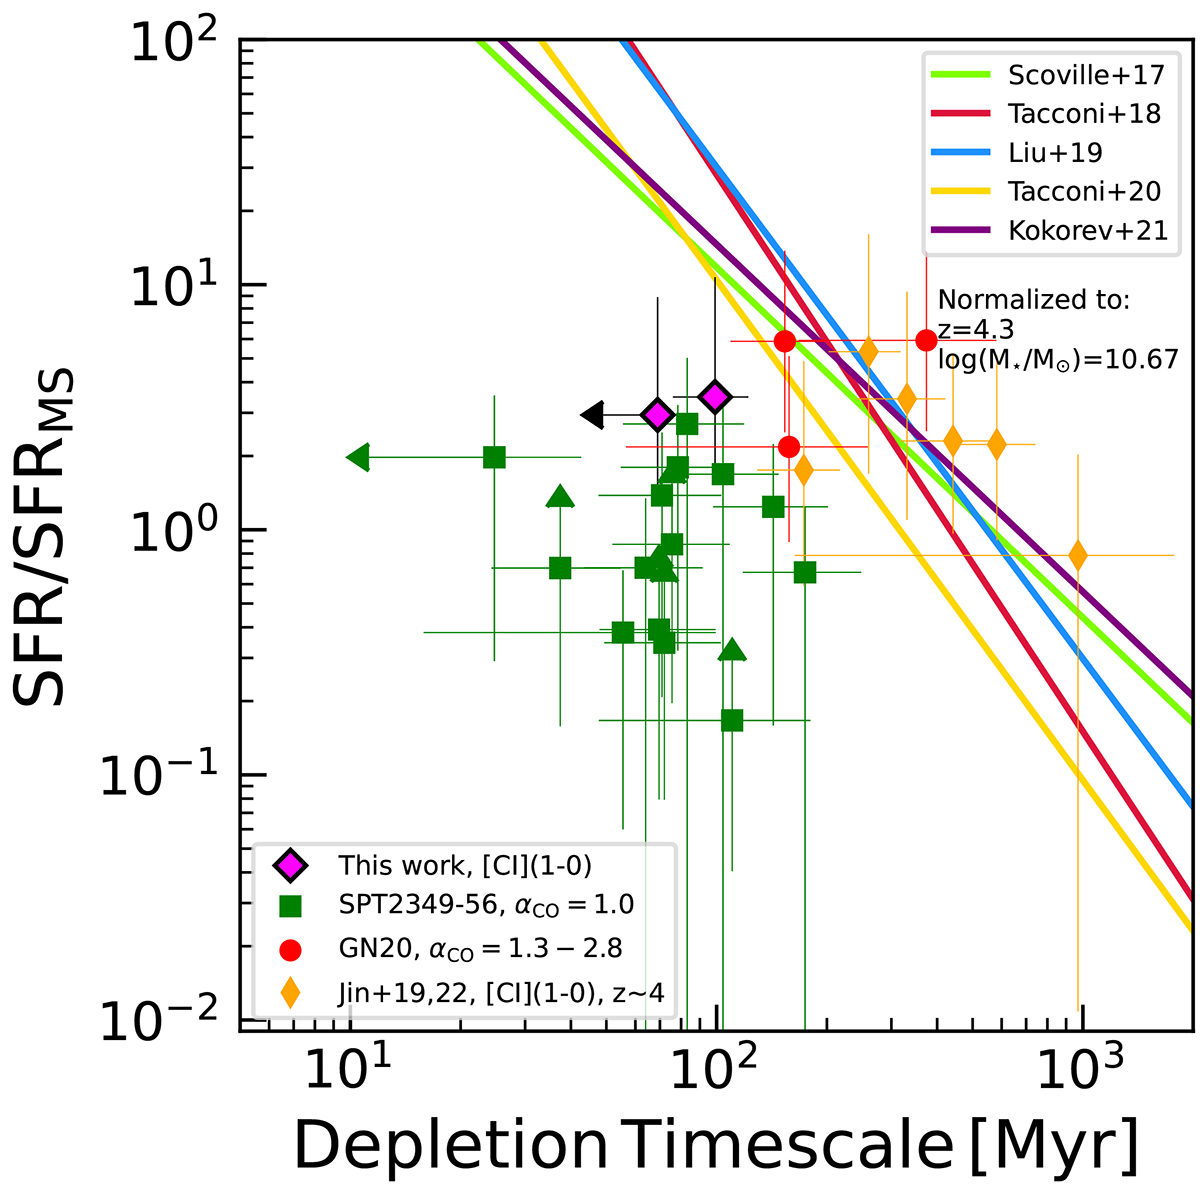
Fig. 6.
Download original image
Offset to the Speagle et al. (2014) galaxy main sequence vs. gas depletion time in Myr. The solid lines indicate the scaling relations of Scoville et al. (2017), Tacconi et al. (2018, 2020), Liu et al. (2019), Kokorev et al. (2021) normalized to z = 4.3 and log(M⋆ [Ṁ]) = 10.67. CGG-z4.a and CGG-z4.b are shown as magenta diamonds, SPT2349-56 galaxies are shown as green squares (Miller et al. 2018; Hill et al. 2020, 2022), GN20 galaxies are shown as red circles (Tan et al. 2014), and the Jin et al. (2019, 2022) galaxies are shown as orange diamonds. Depletion timescales were calculated for the SPT2349-56 galaxies using a gas mass with an αCO = 1.0 and a CO(4–3)/CO(1–0) line ratio r41 = 0.6 ± 0.05 (Spilker et al. 2014). The gas masses of each GN20 galaxy were calculated using the average of αCO derived from the gas-to-dust mass ratio method and dynamical modeling. The gas masses for the galaxies of Jin et al. (2019, 2022) were estimated from [CI](1–0) line data in each paper.
Current usage metrics show cumulative count of Article Views (full-text article views including HTML views, PDF and ePub downloads, according to the available data) and Abstracts Views on Vision4Press platform.
Data correspond to usage on the plateform after 2015. The current usage metrics is available 48-96 hours after online publication and is updated daily on week days.
Initial download of the metrics may take a while.