Open Access
Fig. 3.
Download original image
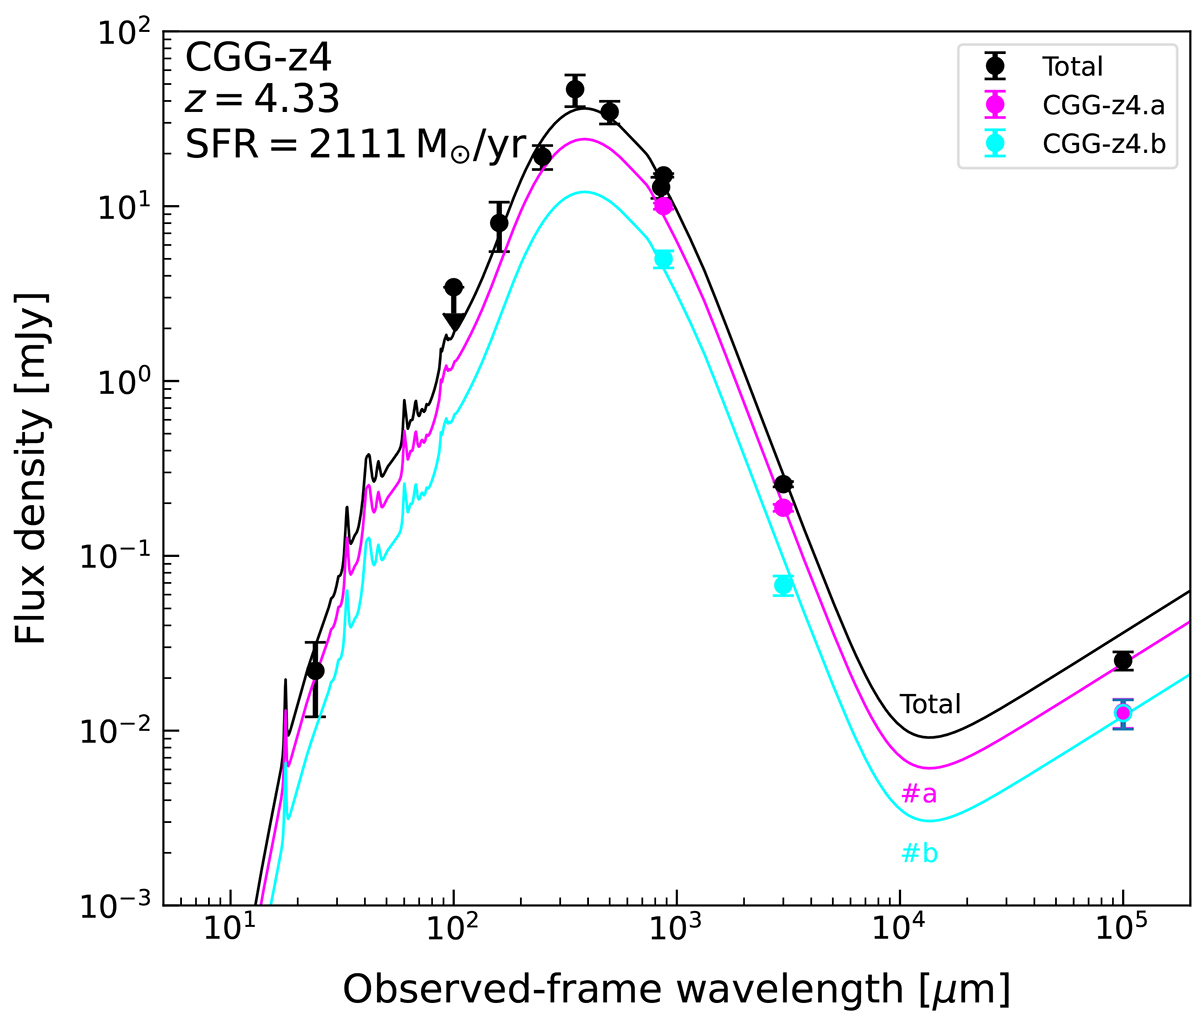
FIR SED of the CGG-z4 integrated group galaxies. Photometry data are shown by circles with error bars or downward-pointing arrows for upper limits if S/N < 3. The magenta and cyan curves are the total SED scaled by the 870 μm flux of CGG-z4.a and CGG-z4.b, respectively.
Current usage metrics show cumulative count of Article Views (full-text article views including HTML views, PDF and ePub downloads, according to the available data) and Abstracts Views on Vision4Press platform.
Data correspond to usage on the plateform after 2015. The current usage metrics is available 48-96 hours after online publication and is updated daily on week days.
Initial download of the metrics may take a while.