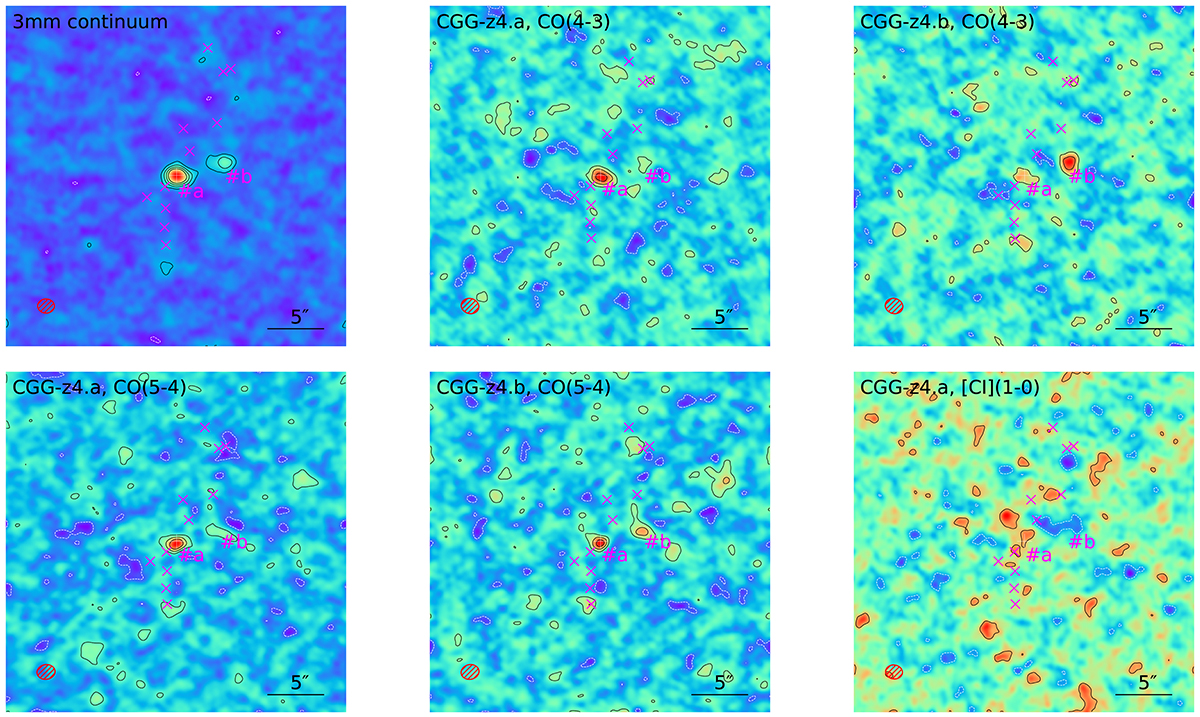
Fig. 2.
Download original image
ALMA line and continuum maps, with black lines showing the positive contours and white dashed lines the negative contours, both starting from 2σ to 6σ in steps of 2σ; except for the continuum map, where the contours start from 3σ to 12σ with 3σ steps. The size and orientation of the beam are indicated in the lower left corner in red. Magenta crosses mark COSMOS2020 sources.
Current usage metrics show cumulative count of Article Views (full-text article views including HTML views, PDF and ePub downloads, according to the available data) and Abstracts Views on Vision4Press platform.
Data correspond to usage on the plateform after 2015. The current usage metrics is available 48-96 hours after online publication and is updated daily on week days.
Initial download of the metrics may take a while.