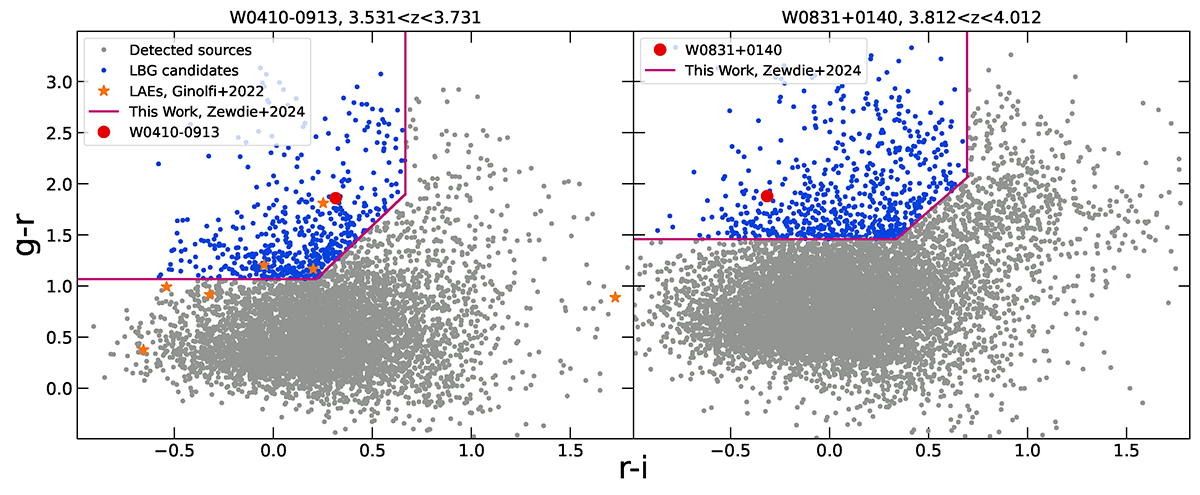
Fig. 7.
Download original image
Distribution of the g − r versus r − i colours of sources around W0410–0913 at z = 3.631 (left panel) and W0831+0140 at z = 3.912 (right panel). The hot DOGs are denoted by red filled-circles. In both panels, grey dots represent detected sources, and the blue dots represent the LBG candidates. The magenta lines show the optimised selection criteria based on the simulated magnitude sources from combined COSMOS2020 (see Section 3). In the left panel, the orange filled stars are the LAEs detected by VLT/MUSE observations (Ginolfi et al. 2022).
Current usage metrics show cumulative count of Article Views (full-text article views including HTML views, PDF and ePub downloads, according to the available data) and Abstracts Views on Vision4Press platform.
Data correspond to usage on the plateform after 2015. The current usage metrics is available 48-96 hours after online publication and is updated daily on week days.
Initial download of the metrics may take a while.