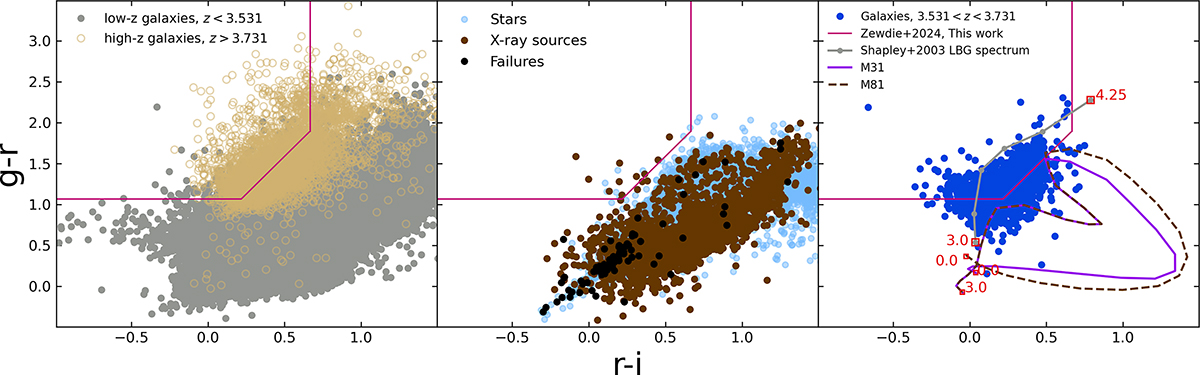
Fig. 4.
Download original image
g − r versus r − i colour distribution of simulated magnitude sources from the combined catalogue in the COSMOS2020 field used to optimise the selection function of companions to W0410–0913 in the redshift range 3.531 < z < 3.731. The left panel represents galaxies at lower redshifts (z < 3.531, grey) and higher redshifts (z > 3.731, tan). The middle panel displays stars, X-ray sources, and sources with failed photometric redshift measurements, while the right panel shows galaxies in the targeted redshift range of 3.631 ± 0.1. The solid magenta line represents the optimised selection function at 3.531 < z < 3.731. The grey line shows the colour–redshift track of the LBG composite spectrum of Shapley et al. (2003) with the IGM absorption of Madau (1995) shifted from z = 3.0 to z = 4.25, where the dots indicate Δz = 0.25. We show the representative colours of several classes of galaxies from Coleman et al. (1980) as a function of redshift from z = 0 to z = 3.0.
Current usage metrics show cumulative count of Article Views (full-text article views including HTML views, PDF and ePub downloads, according to the available data) and Abstracts Views on Vision4Press platform.
Data correspond to usage on the plateform after 2015. The current usage metrics is available 48-96 hours after online publication and is updated daily on week days.
Initial download of the metrics may take a while.