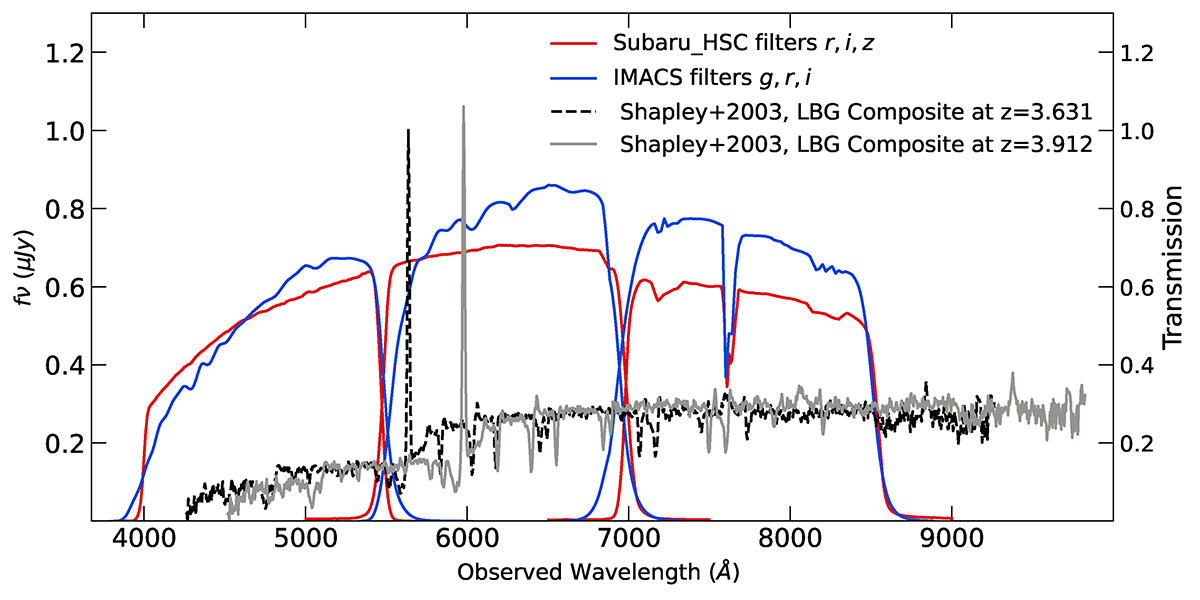
Fig. 3.

Download original image
Composite LBG spectrum from Shapley et al. (2003) shifted to z = 3.631 (black dashed lines) and z = 3.912 (grey solid lines), used for optimising the selection function for the W0410–0913 and W0831+0140 fields, respectively. After accounting for quantum efficiency and atmospheric transmission, the red and blue lines represent the HSC filter curves (used for optimisation and the blank field) and the IMACS filter curves (used for W0410–0913 and W0831+0140), respectively.
Current usage metrics show cumulative count of Article Views (full-text article views including HTML views, PDF and ePub downloads, according to the available data) and Abstracts Views on Vision4Press platform.
Data correspond to usage on the plateform after 2015. The current usage metrics is available 48-96 hours after online publication and is updated daily on week days.
Initial download of the metrics may take a while.


