Fig. 1.
Download original image
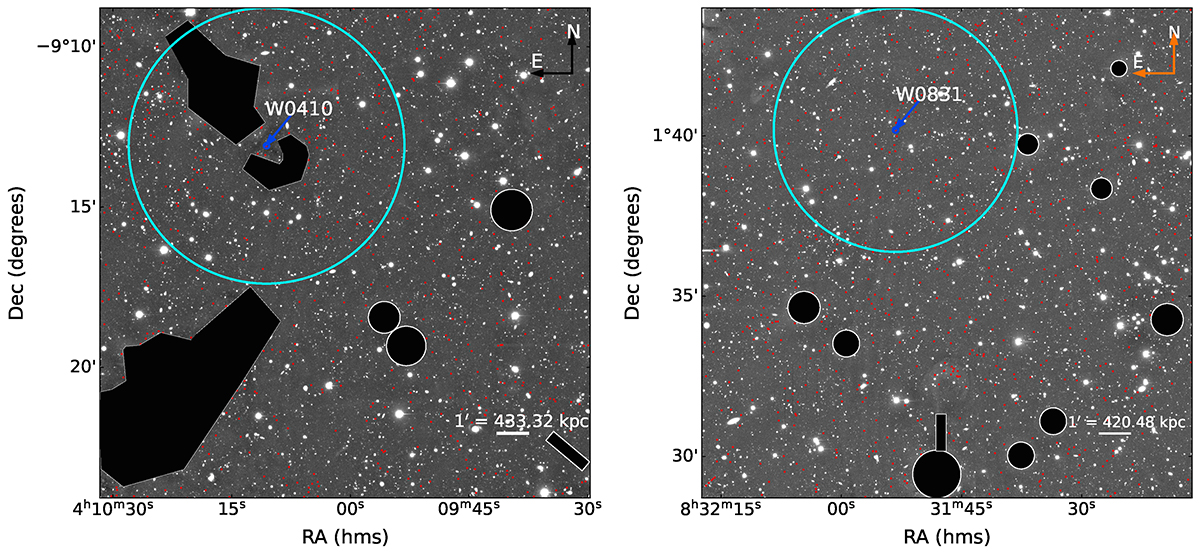
r-band image of W0410–0913 (left-panel) and W0831+0140 (right-panel). In both panels, black circles and polygons show the masked area that we did not use for our LBG selection (see Section 2.1 for details). The blue circles and arrows indicate the hot DOGs positions, and the cyan circle represents the largest area centred on the hot DOG within the image bounds. The red circles are candidate LBG companions.
Current usage metrics show cumulative count of Article Views (full-text article views including HTML views, PDF and ePub downloads, according to the available data) and Abstracts Views on Vision4Press platform.
Data correspond to usage on the plateform after 2015. The current usage metrics is available 48-96 hours after online publication and is updated daily on week days.
Initial download of the metrics may take a while.